Jefe’s Portfolio
Introduction
My name is Joseph Hefner. I do freelance work that mainly consists of NFL graphics, specifically tables and plots that show different stats for players and teams. I write weekly articles for KC Sports Network, and create graphics for them. In addition, I write shiny apps, several of which you can find right here on this website. This website is entirely my own work. I wrote it in Quarto. I am also proficient in the R coding language, and use it to create my graphics.
I have created graphics for both Fantasy Points and for FTN. I wrote several shiny apps for BTB Analytics.
Portfolio
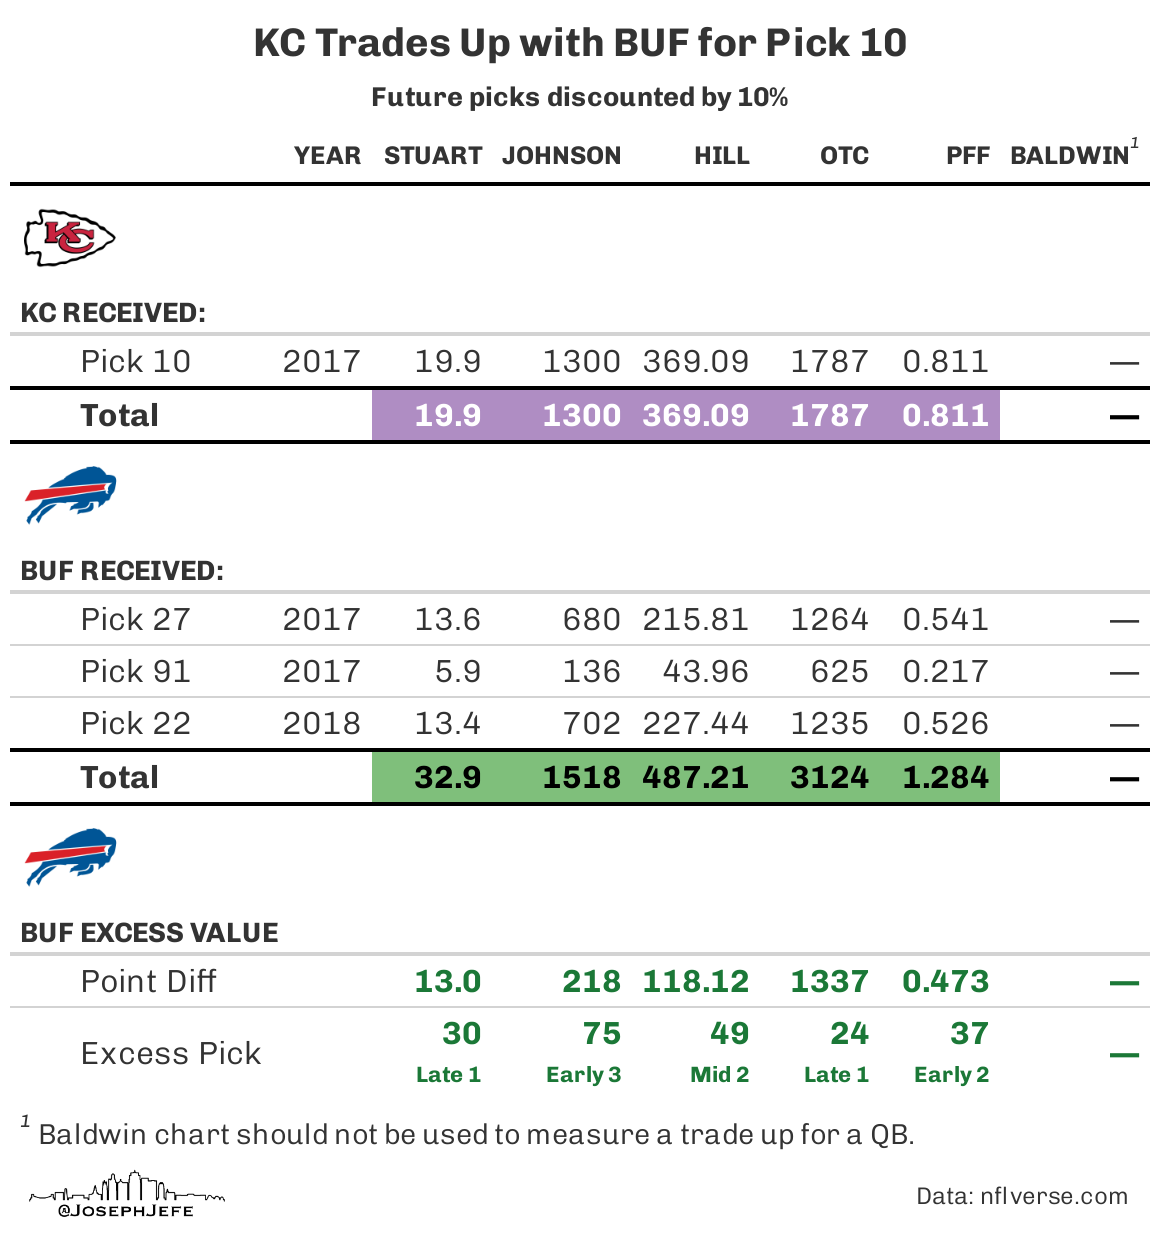
Trade Calculator
The Trade Calculator App takes input from 6 different trade charts and generates a graphic that shows the value each chart places upon each pick in the trade, along with totals for each team, and a positive or negative surplus value for the trade down team.
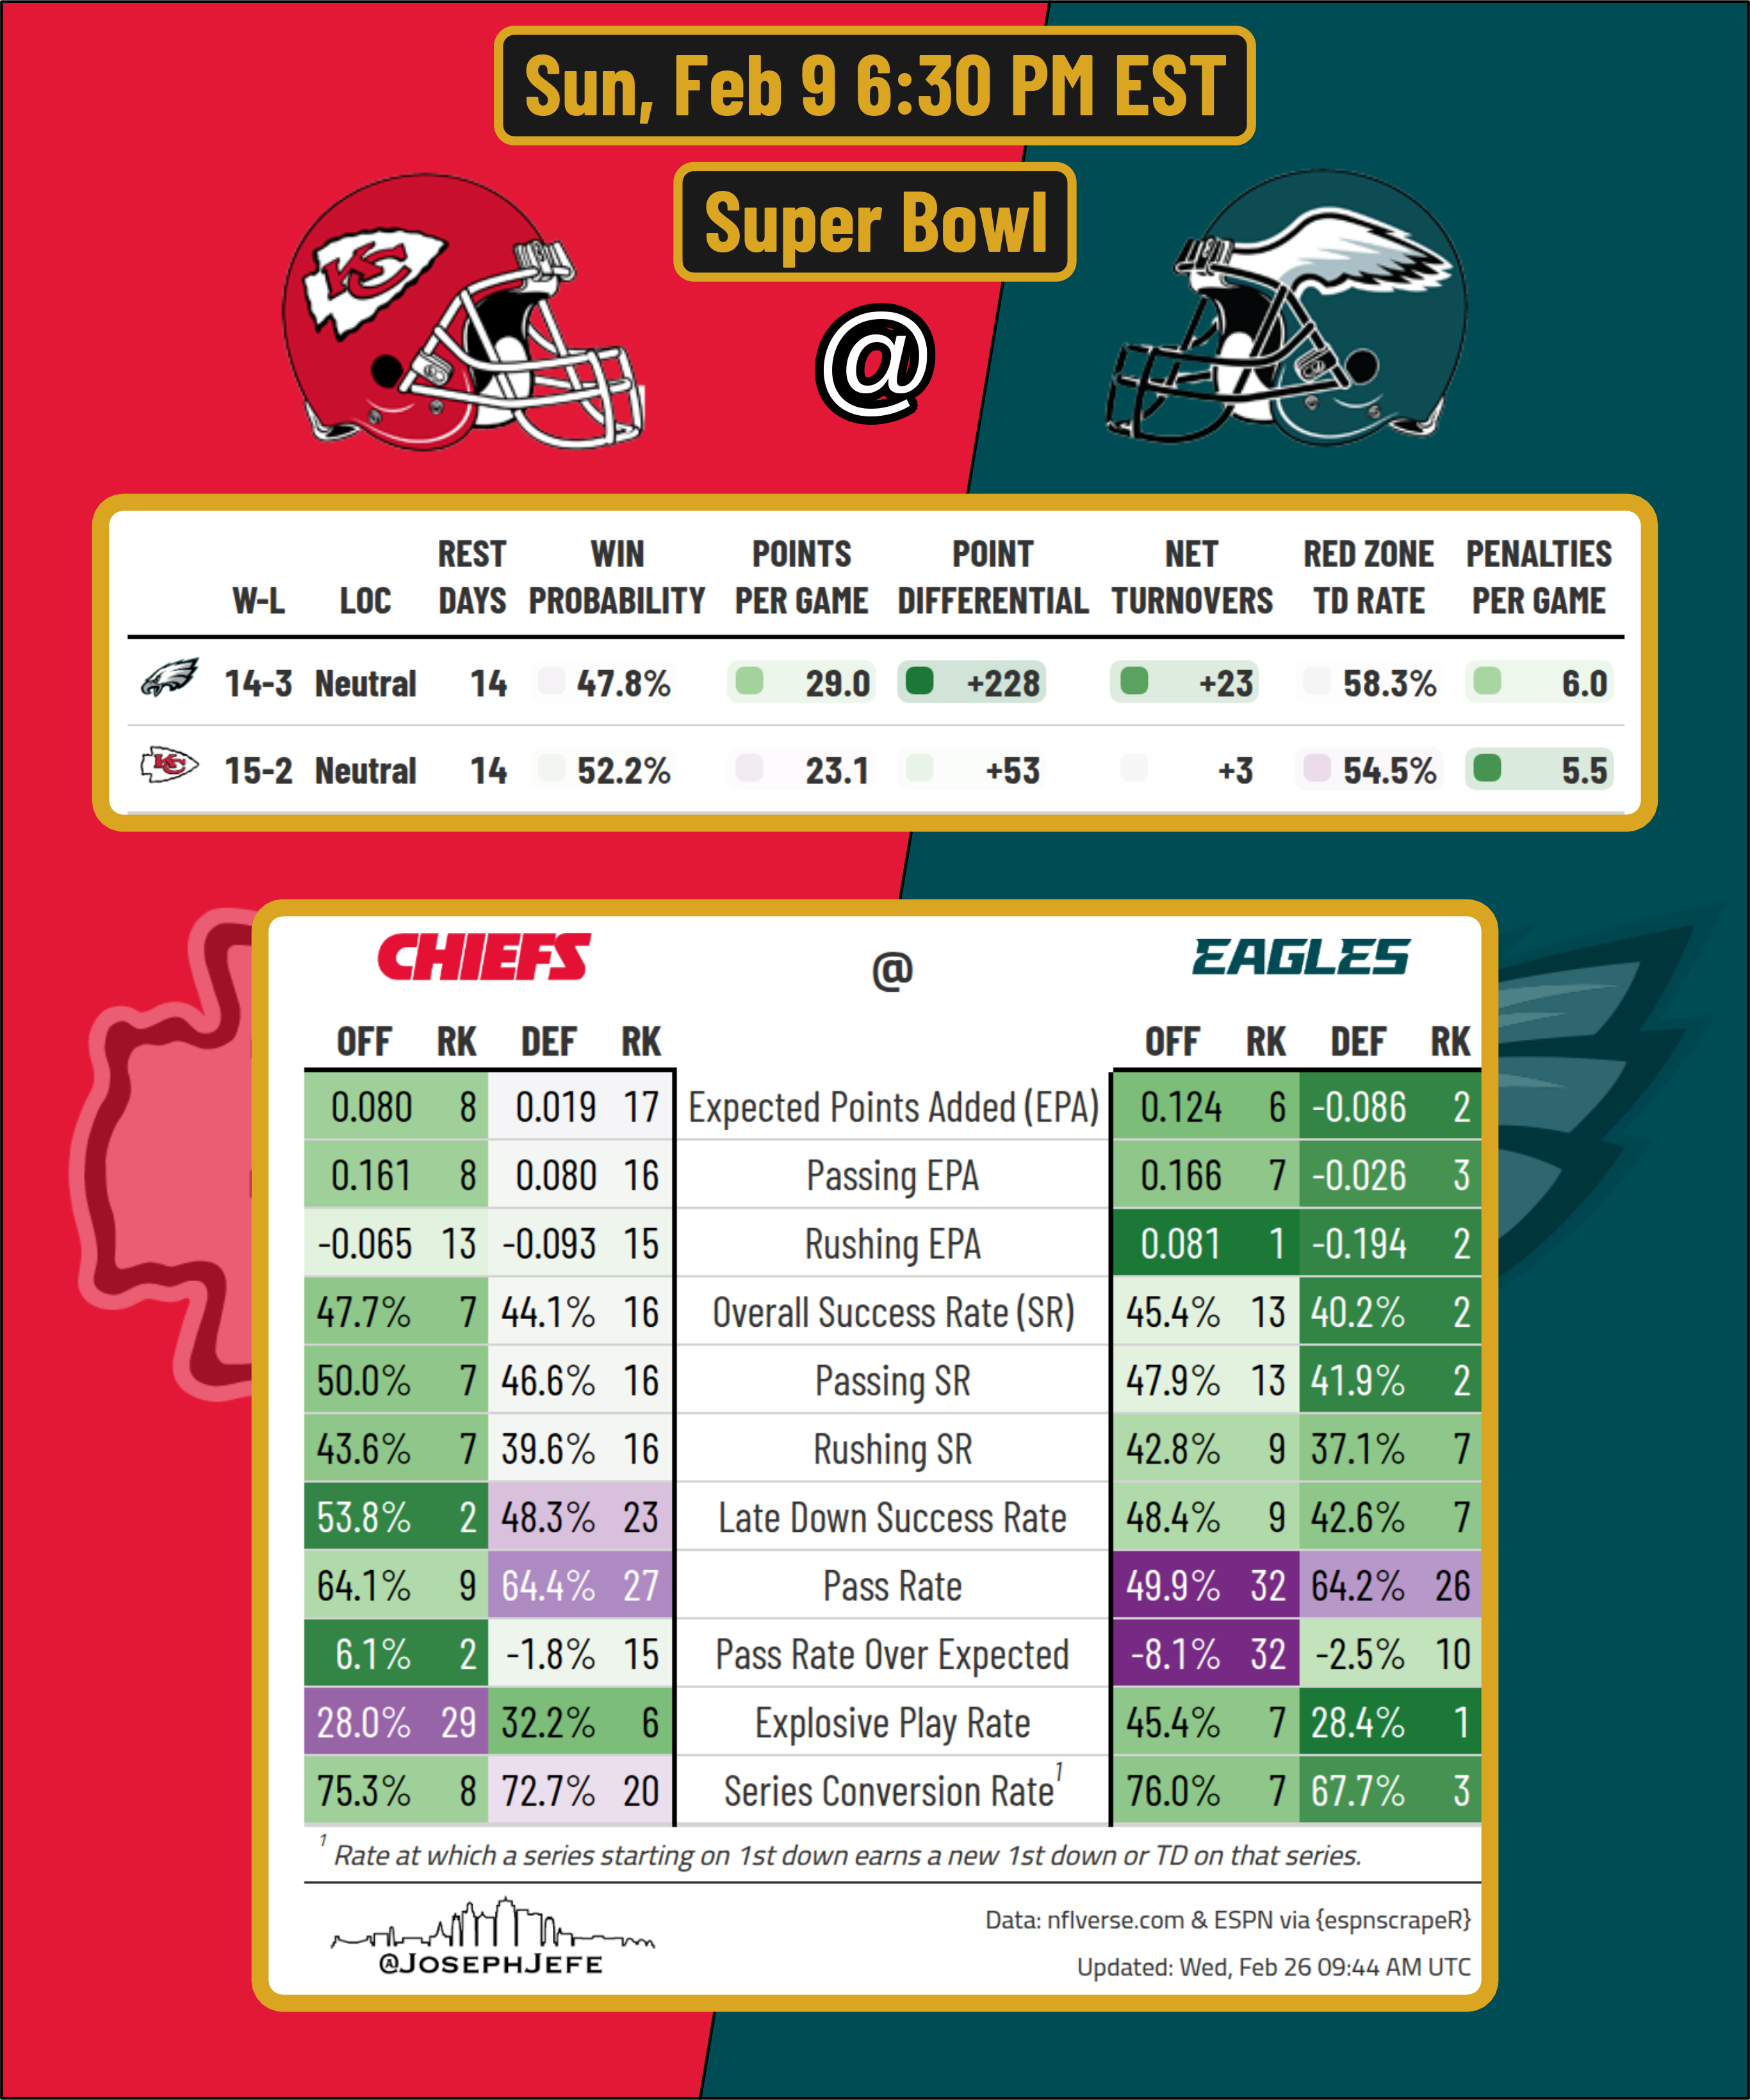
Game Preview Cards
The Game Preview Cards App allows you to choose a game from the current week (or previous weeks) and generate a preview of those two teams side by side. It generates a list of different stats and rankings for both teams.
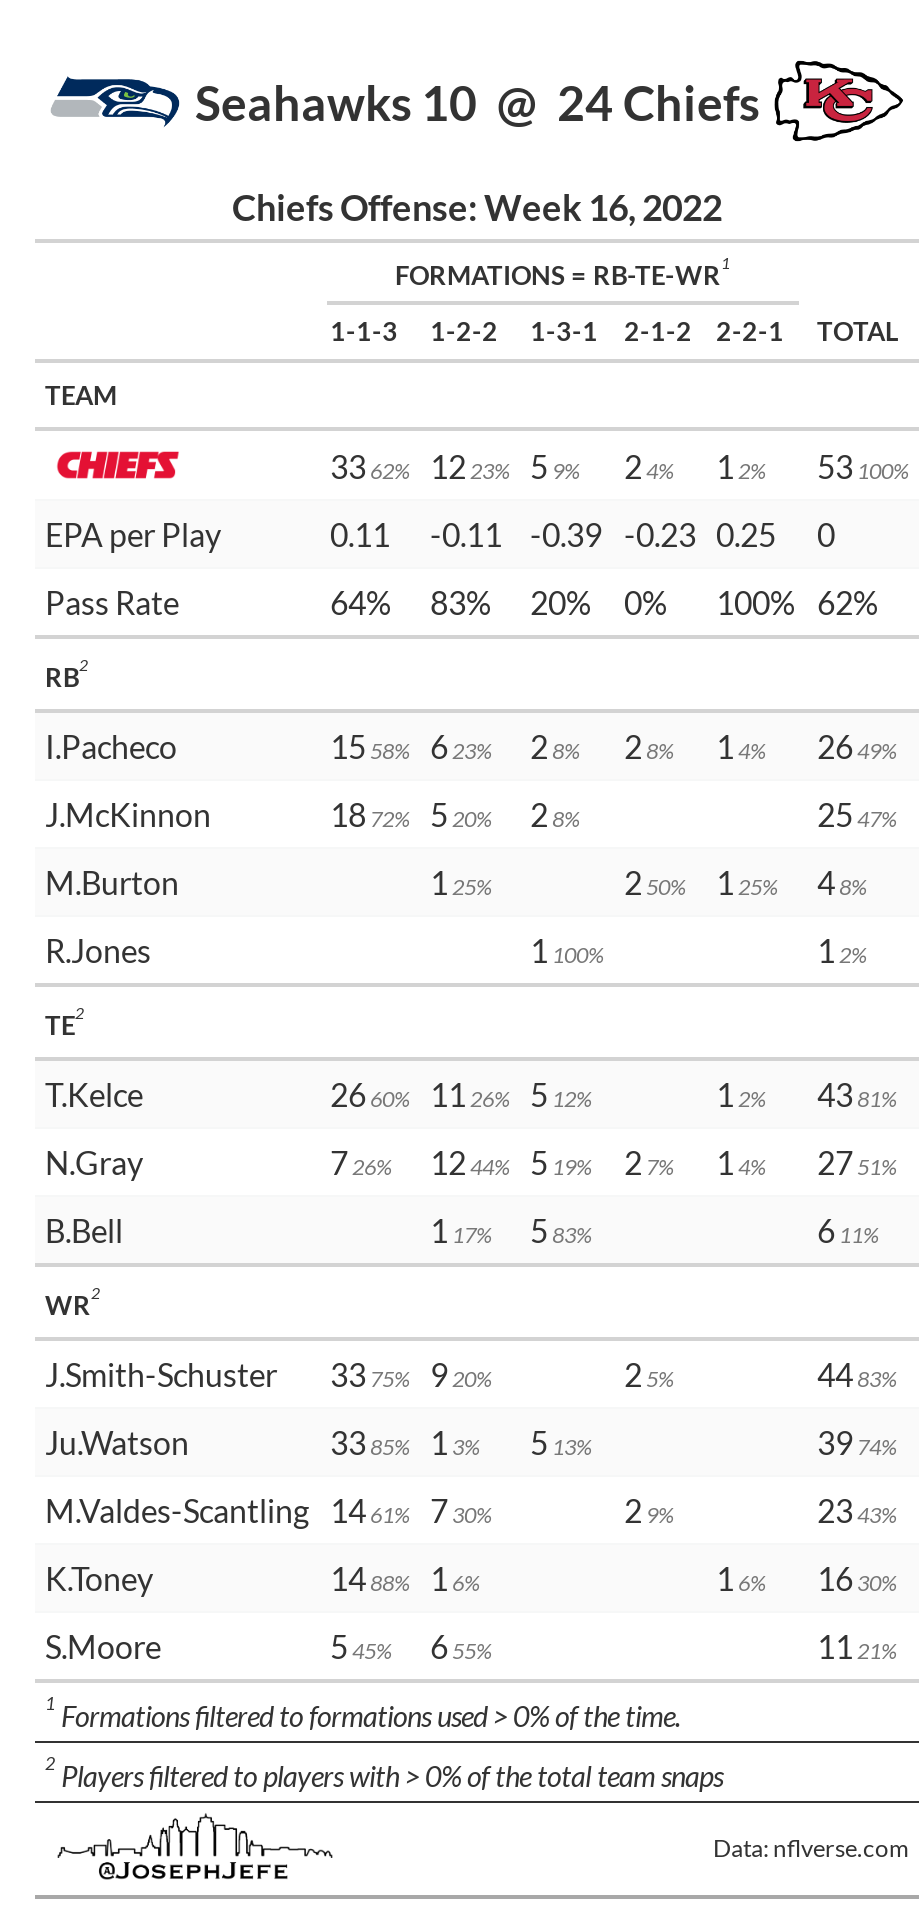
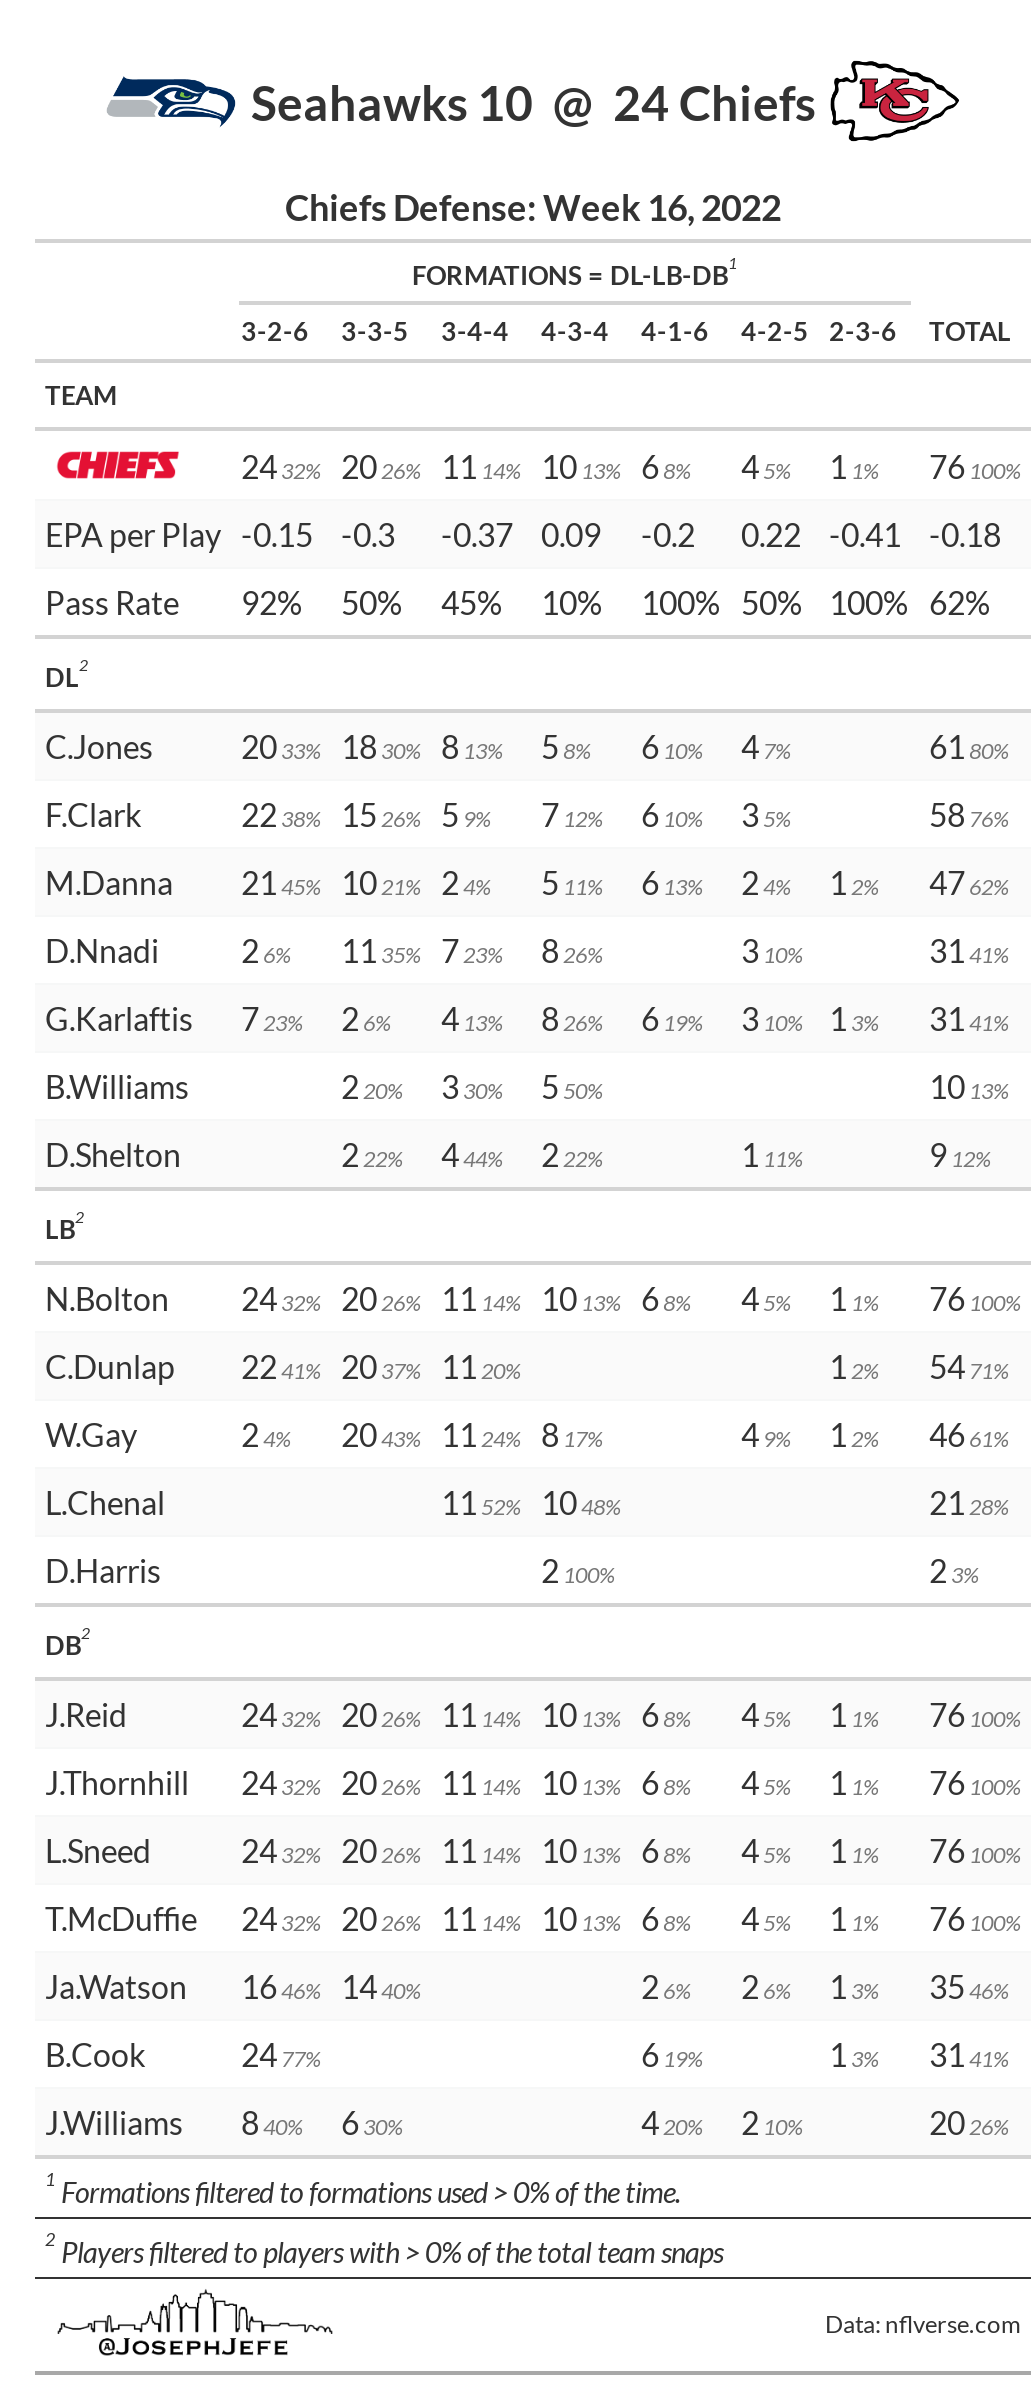
Team Formations
The Team Formations Shiny App allows you to see the offensive or defensive formations that a specific team was in, either for a specific game, or across a range of games in a season. It can also show you the offensive or defensive formations that a specific team has faced over the course of a selected range of games.
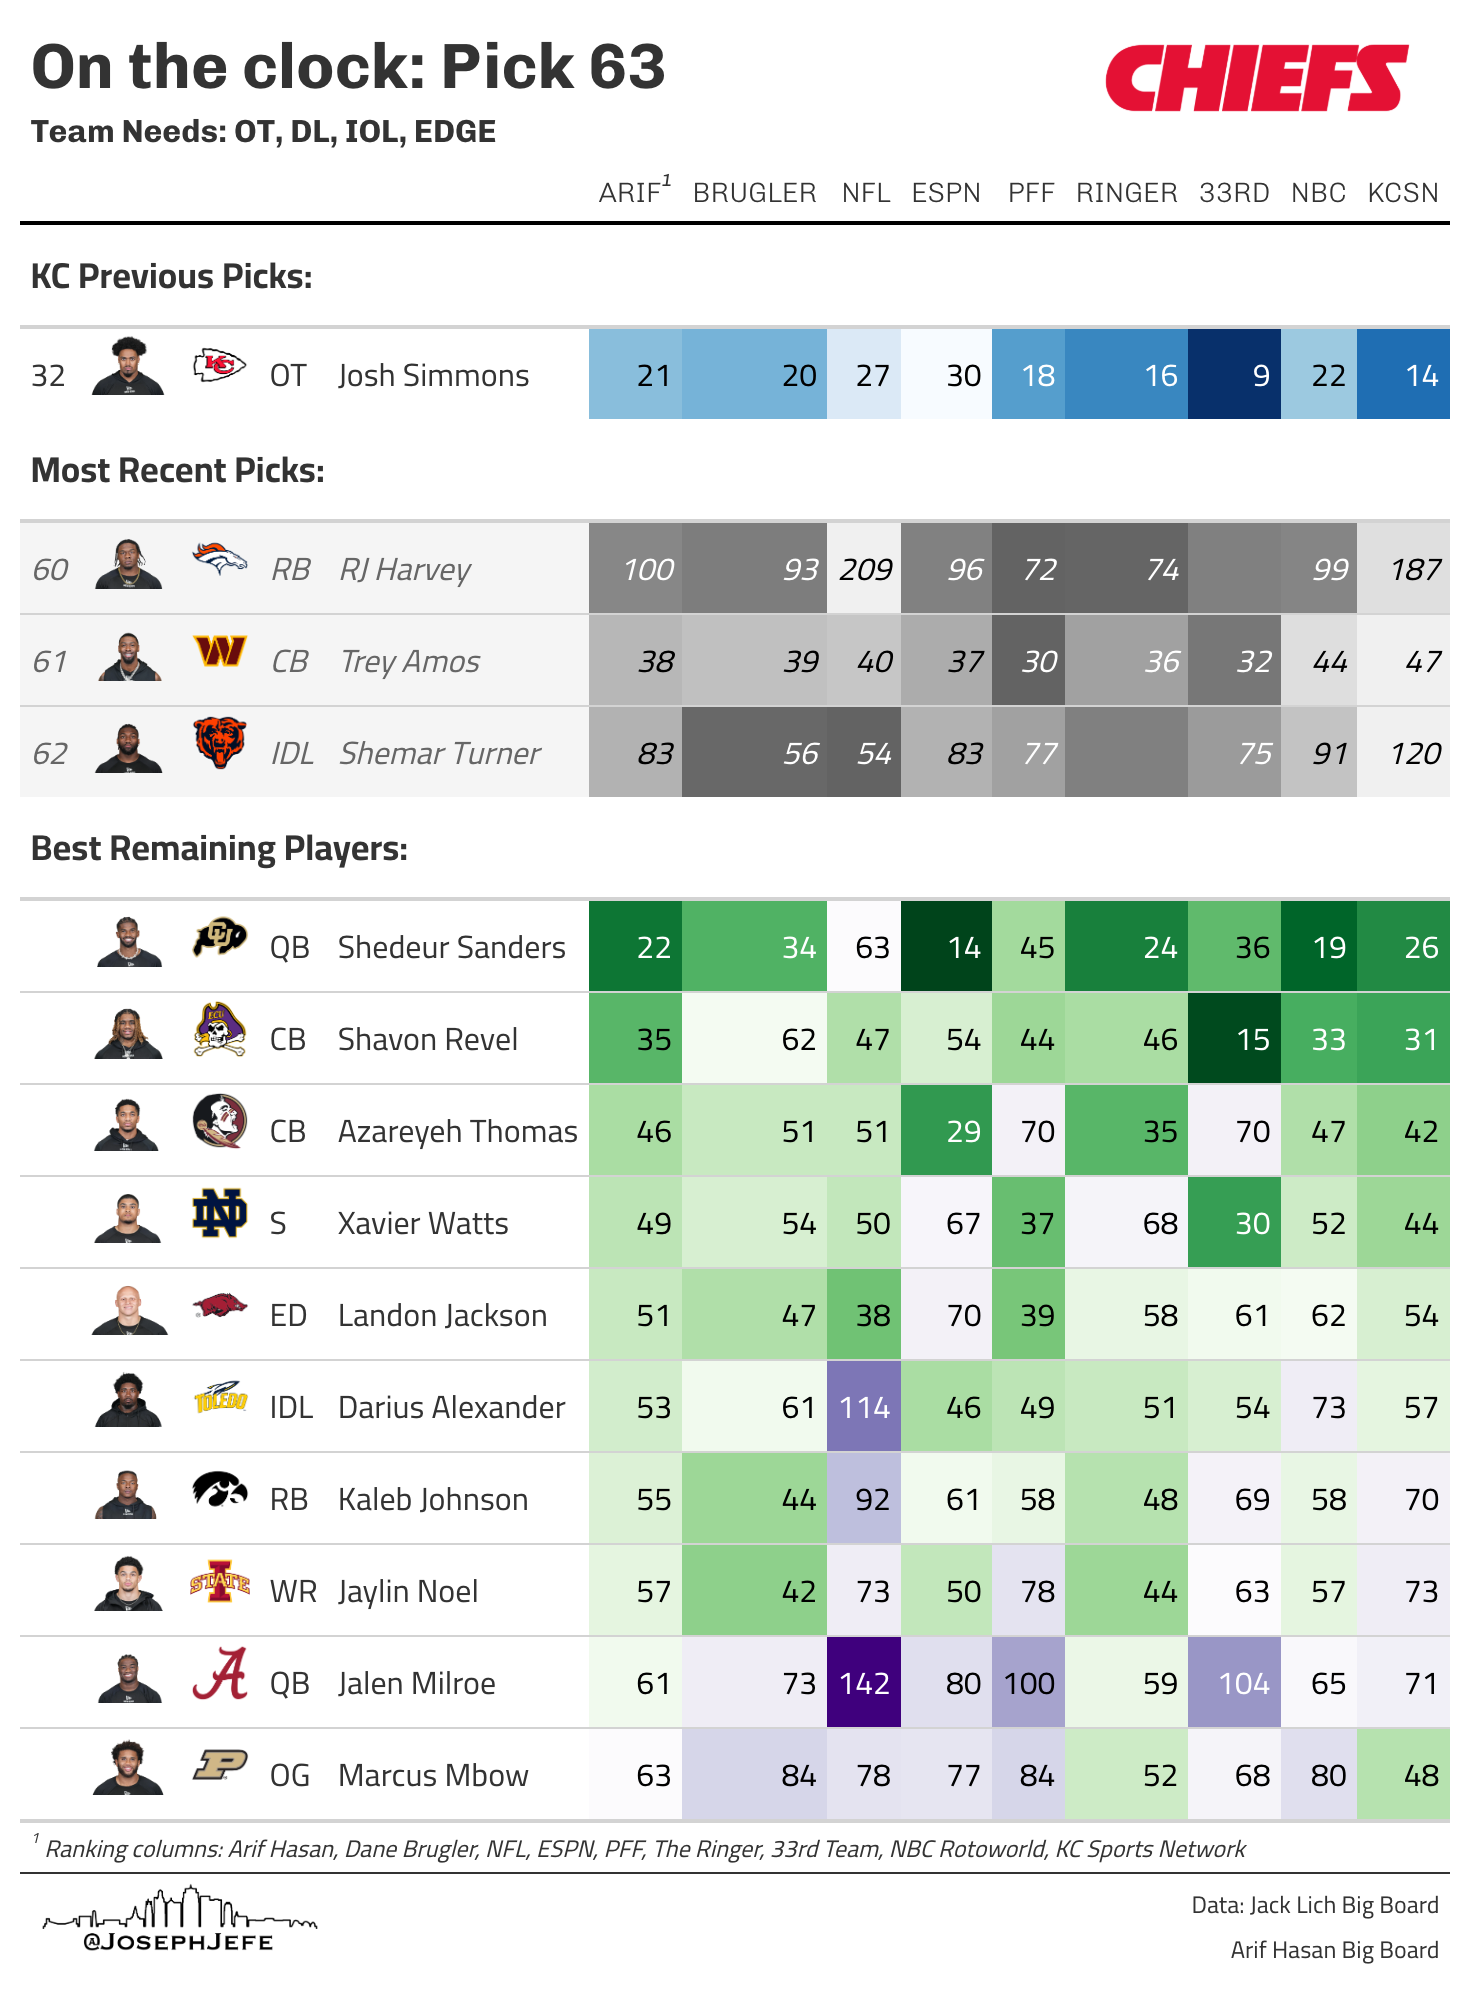
Best Available
For the draft, I created a graphic that shows the best available players left in the draft, based on the Arif Hasan Consensus Board. It has several other big boards as well. It also shows any players the team on the clock has already selected, plus the most recent selections prior to that pick.
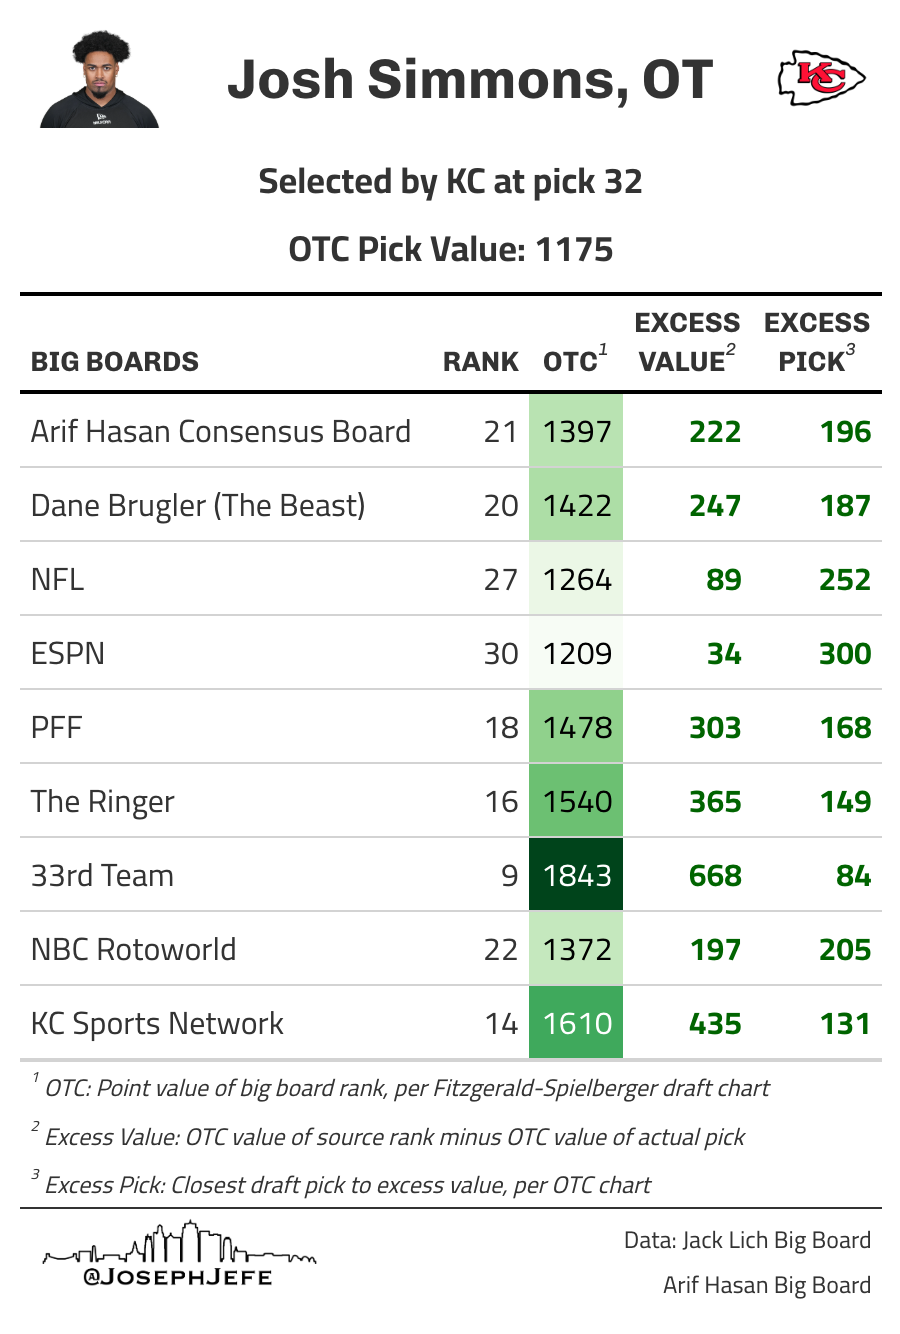
Player Draft Card
I also developed a Draft Card that shows the placement of a specific player on several popular draft boards, and compares the value of the big board ranking to the value of the actual pick used on the player, using the Fitzgerald-Spielberger (OTC) draft chart.
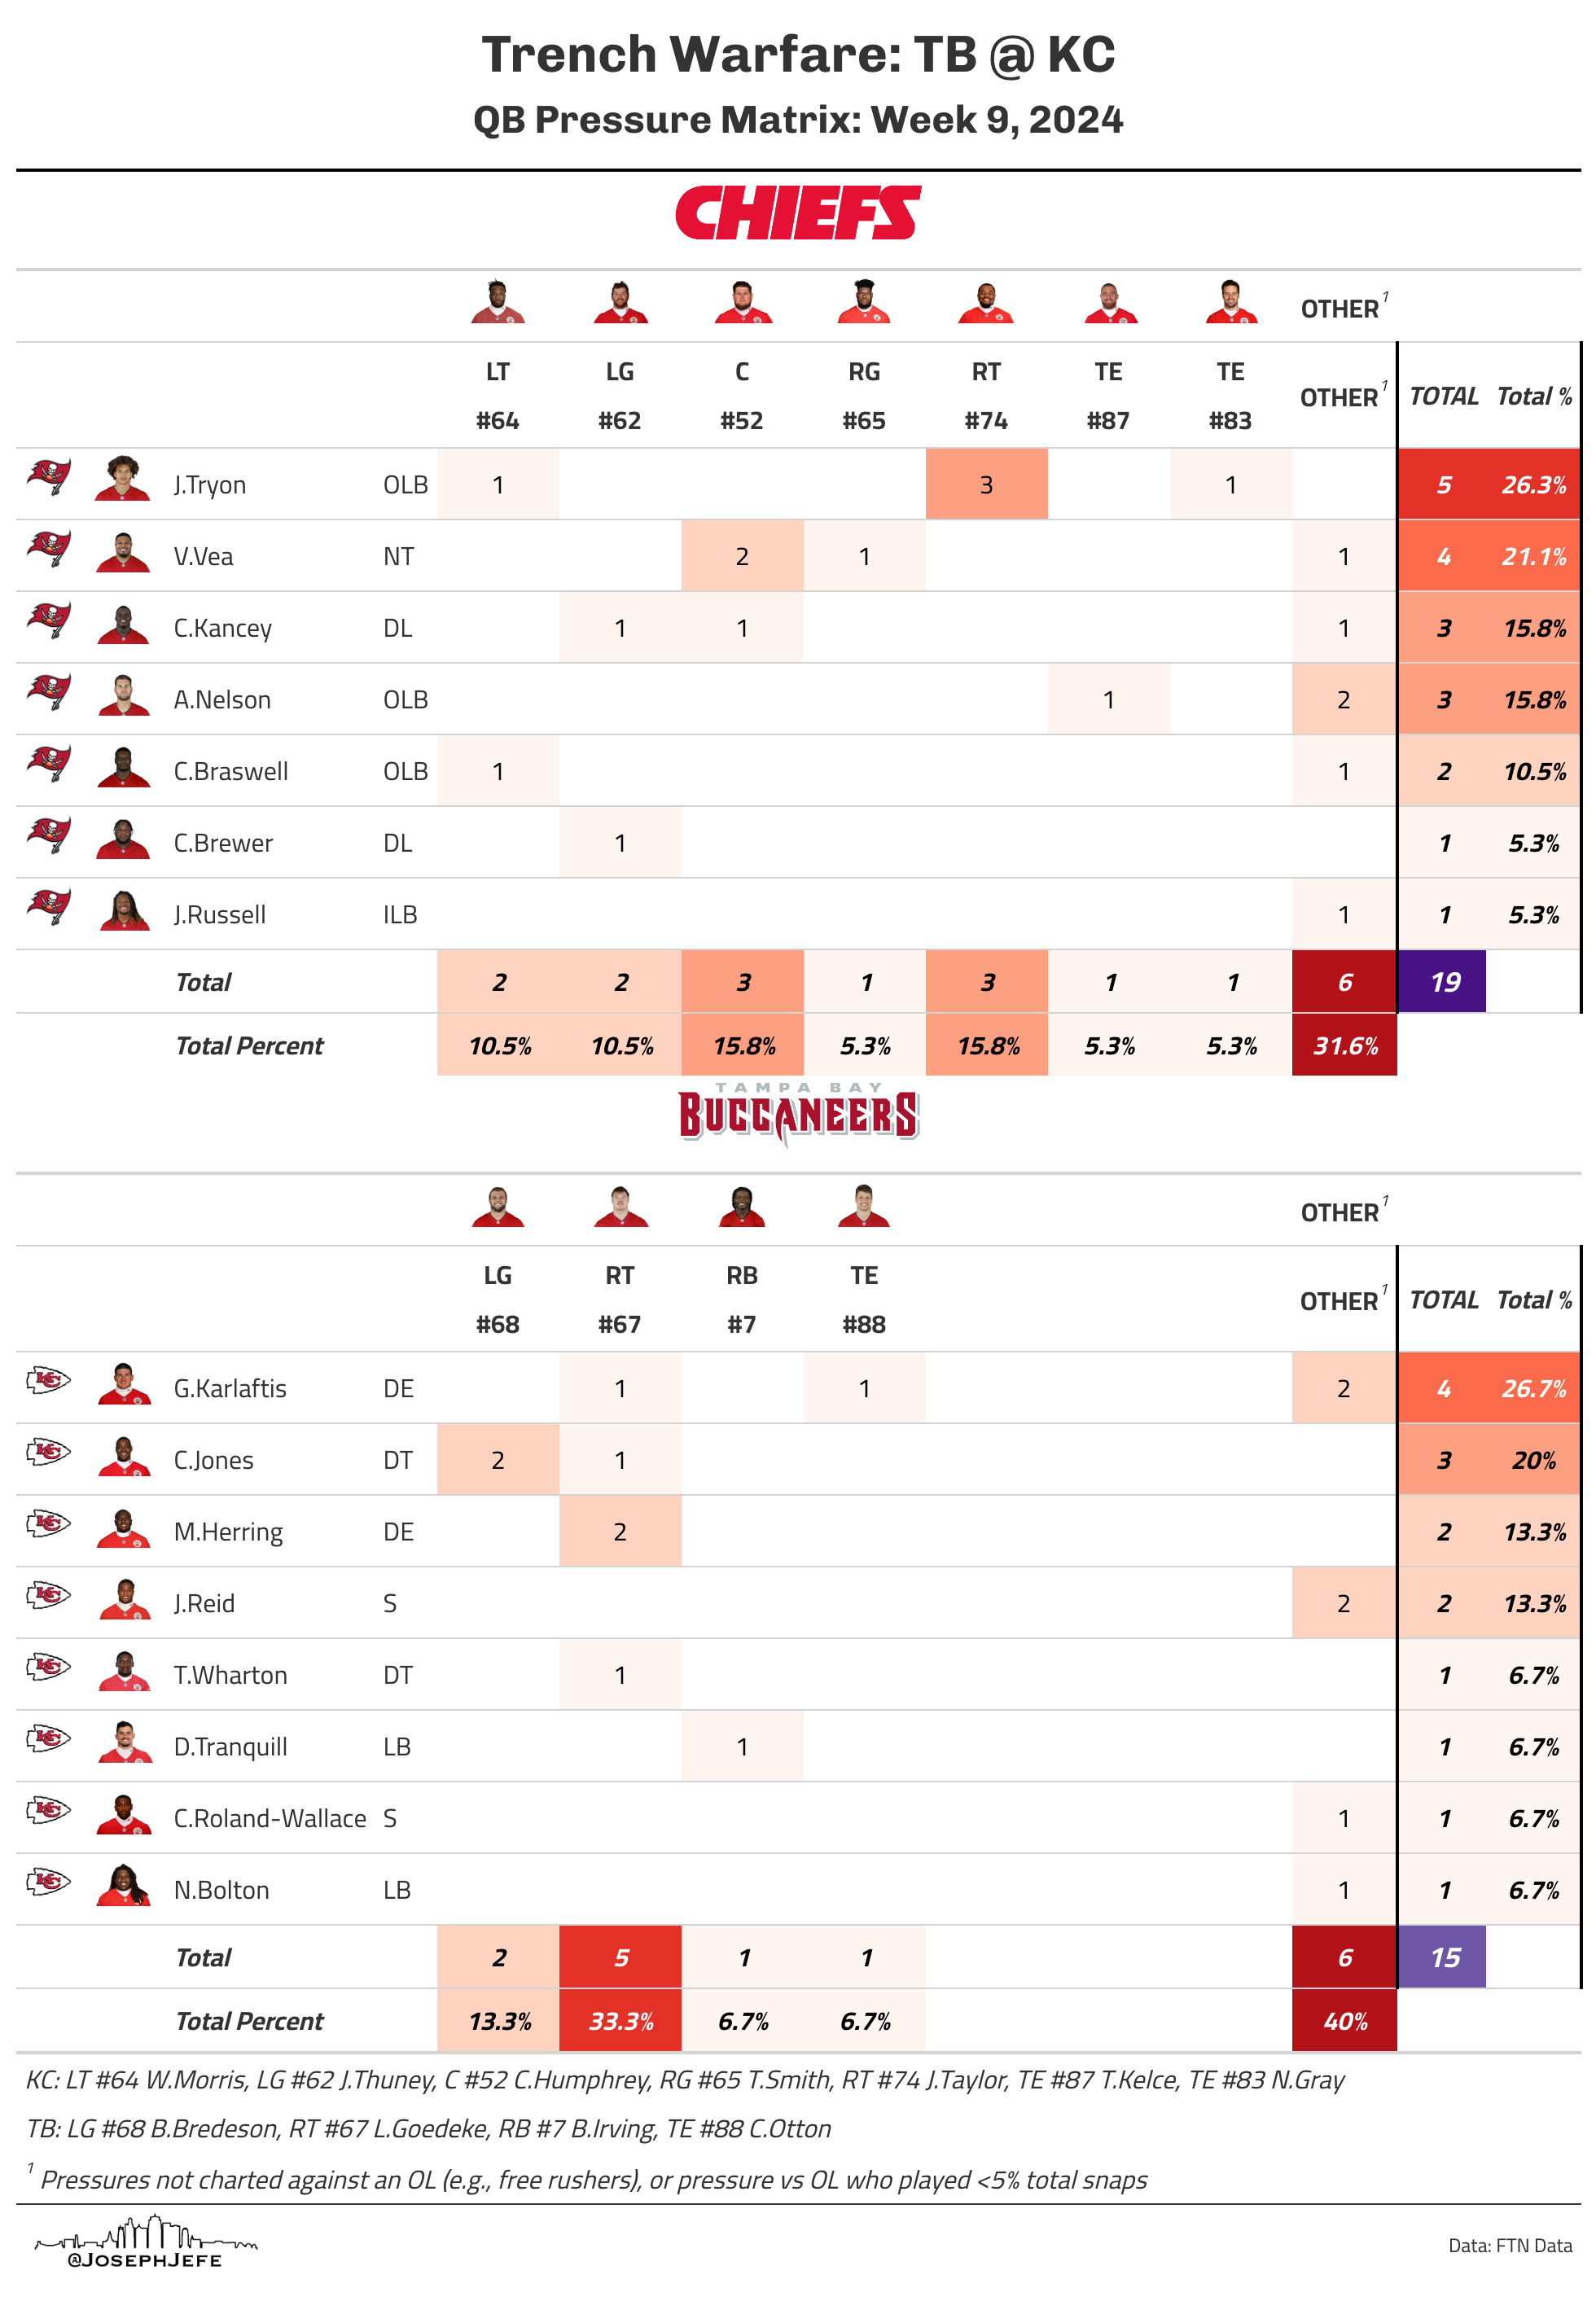
Trench Warfare
This graphic uses FTN data to show which defensive players got pressure in a given game, and against which offensive players that pressure was earned (if any).
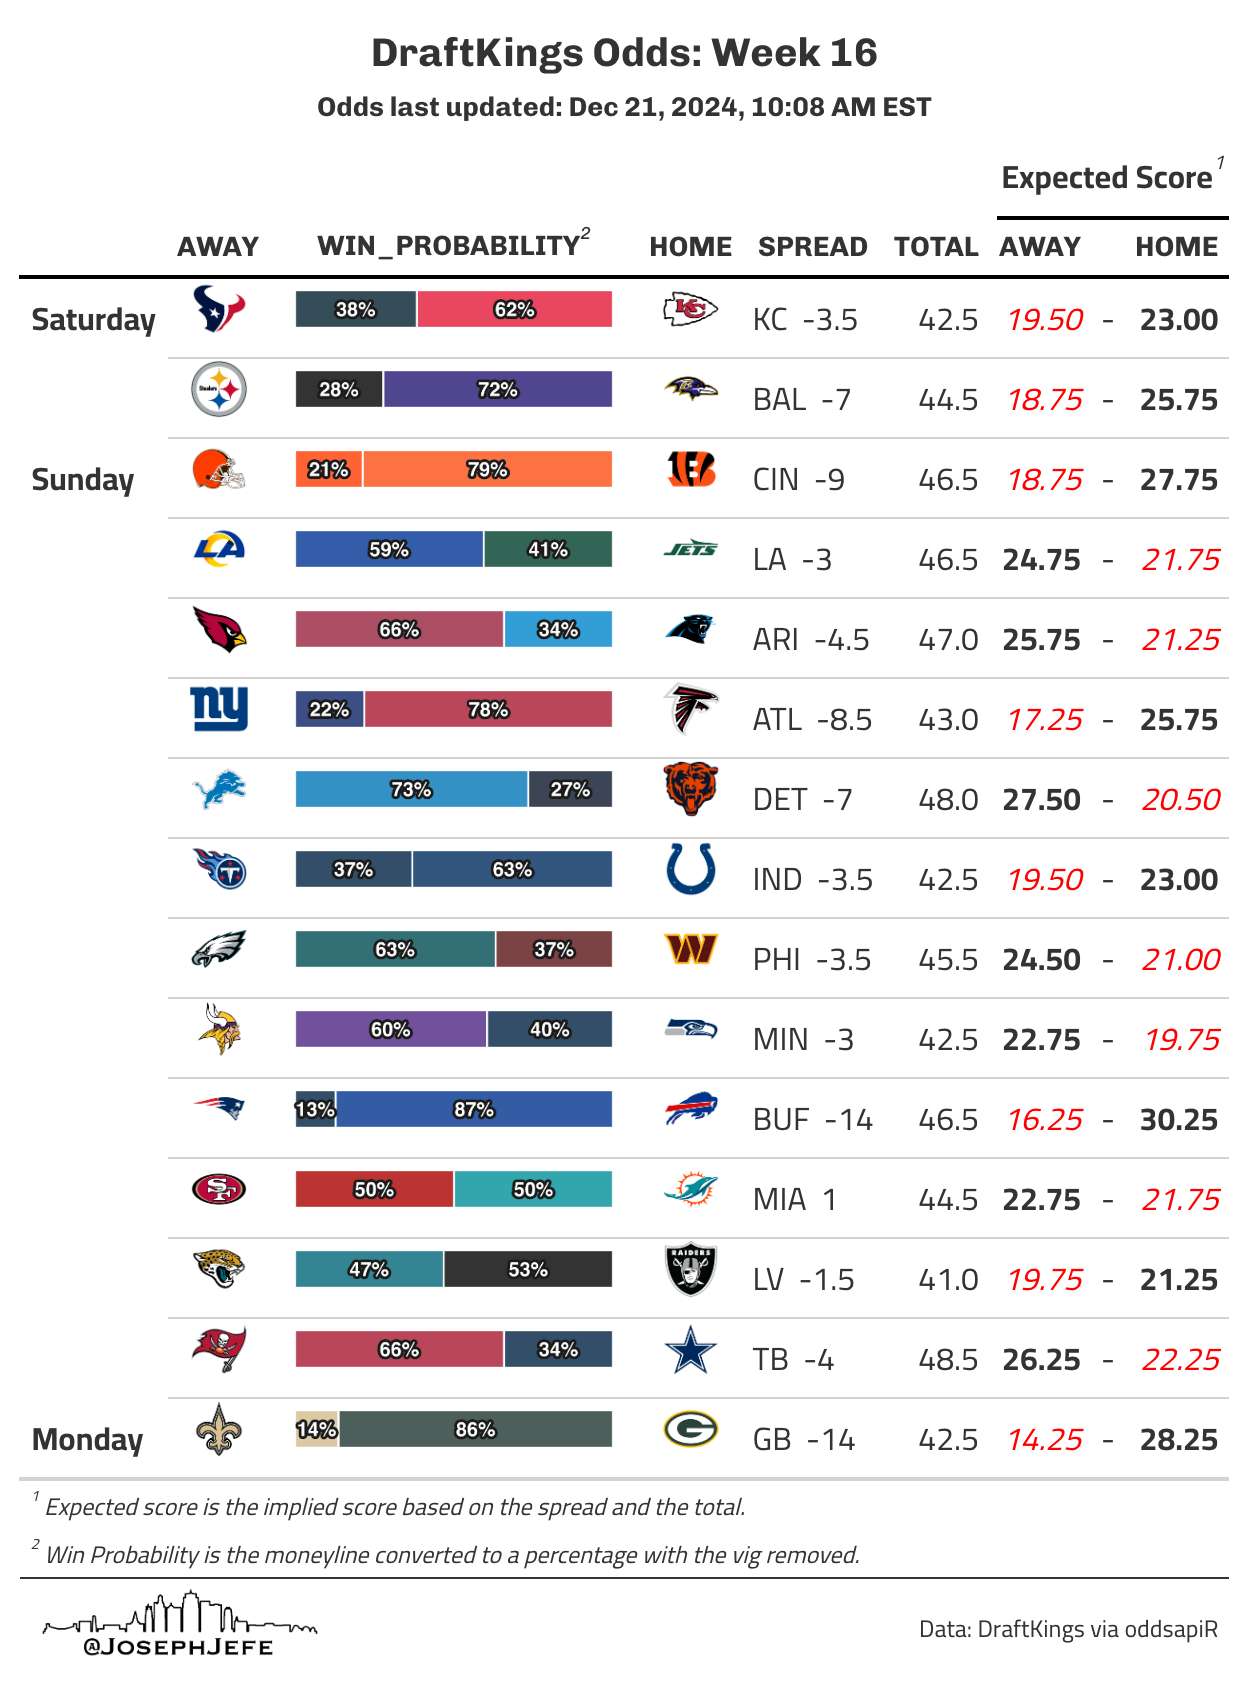
Weekly Odds
This graphic takes DraftKings odds for game moneylines, point spreads, and totals, and shows how that looks as win probability and expected scores.
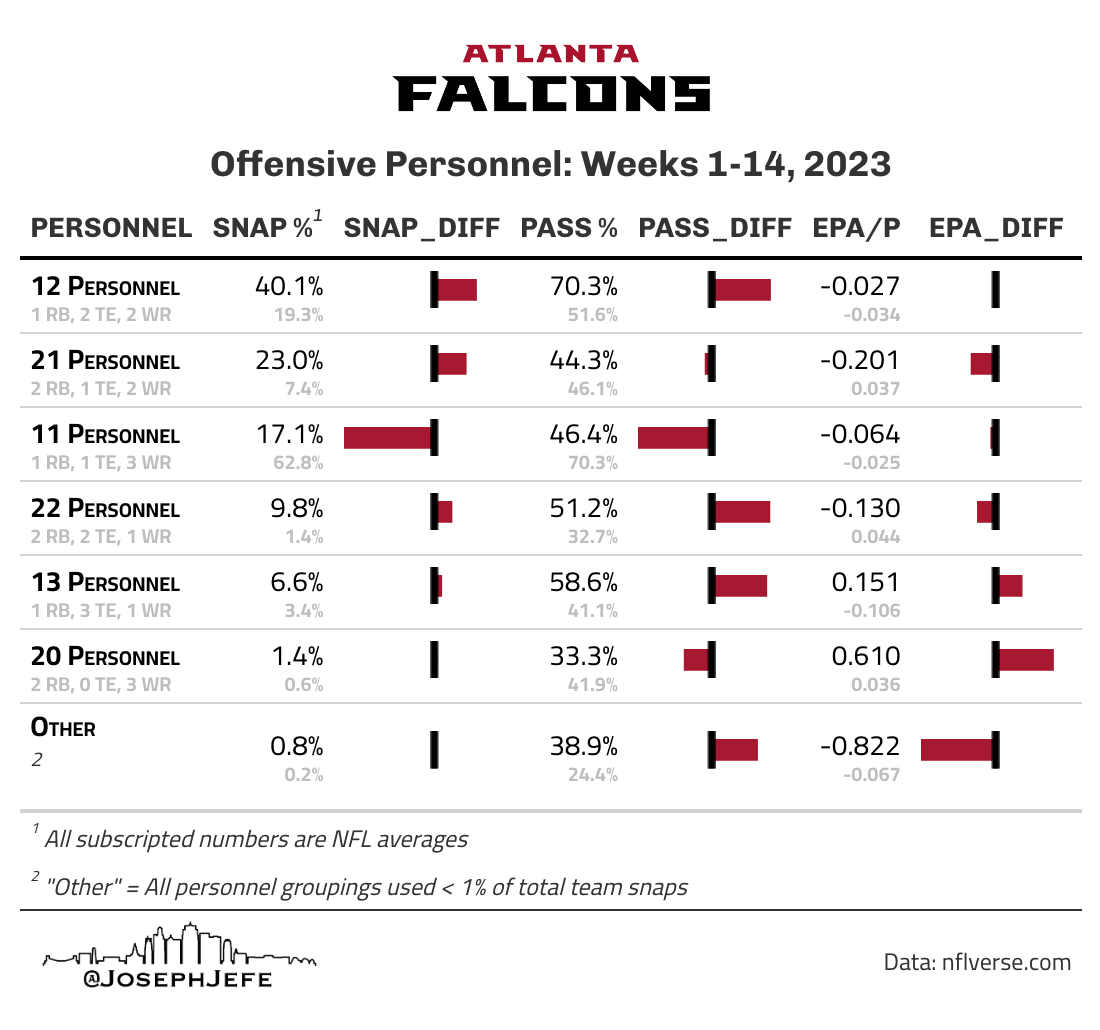
Personnel Packages
This graphic looks at the personnel packages that NFL teams have used throughout the season. It shows their most used packages, how often they use it, how often the NFL as a whole uses it, and the difference between the two. It also shows often the team passes out of that package, and their EPA when using that package. There is a comparison to the NFL average for both of those stats as well.
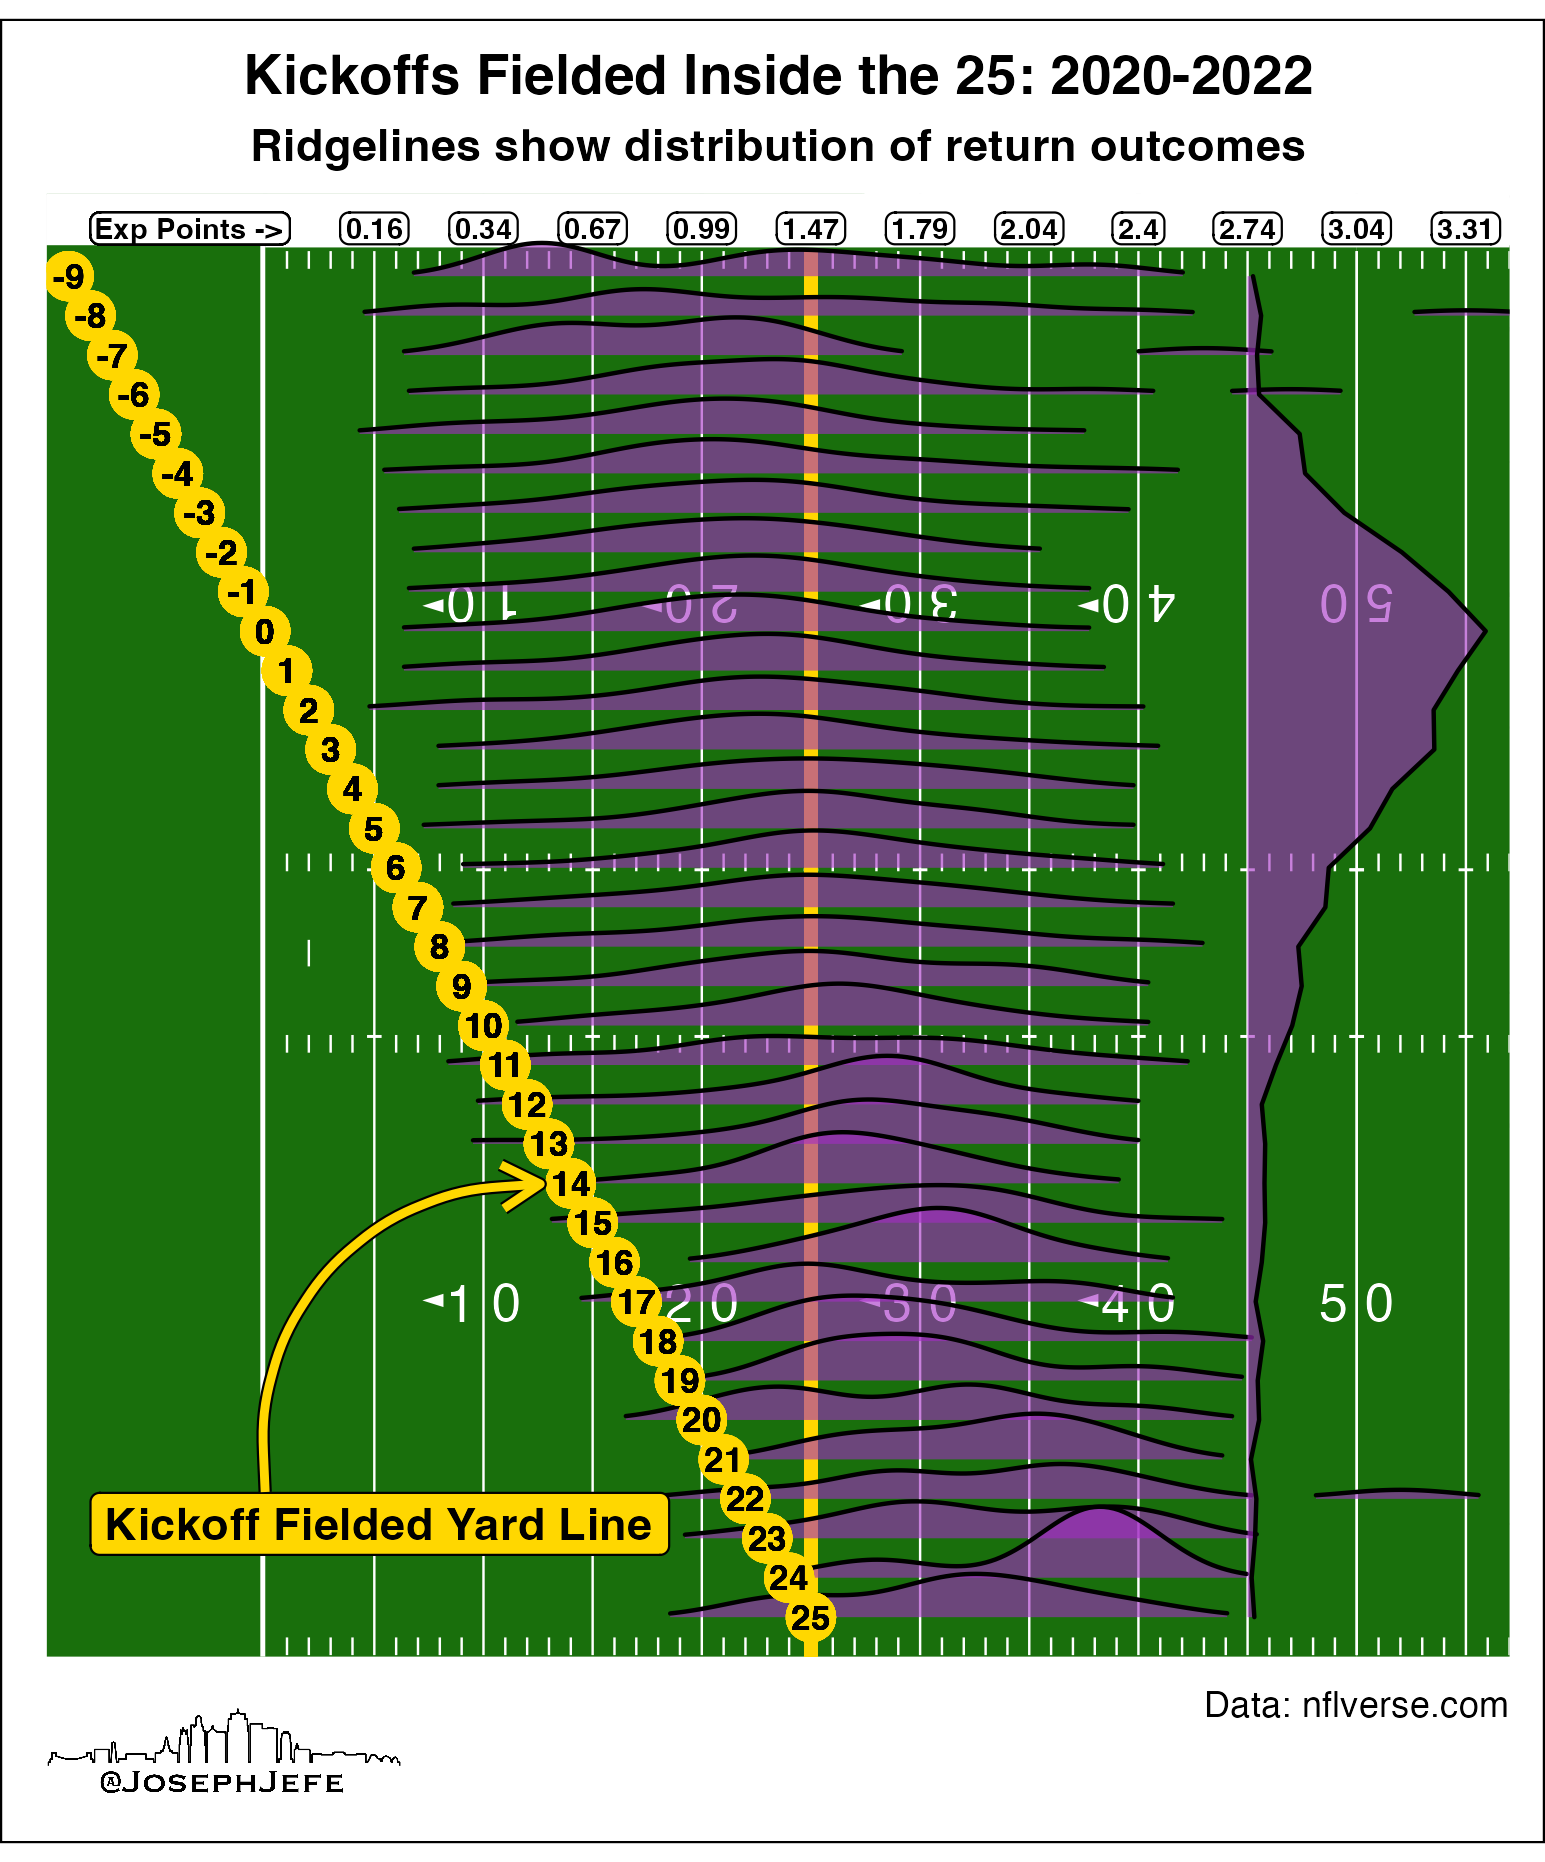
Kickoffs
This graphic is an older graphic I did when the NFL changed the kickoff rule to allow kick returners to fair catch the ball inside the 25 yard line, and have it come out to the 25 yard line. The gold dot shows where the returner caught the ball, and the ridgeline shows the distribution of return outcomes, or how far the returner was able to return the ball.
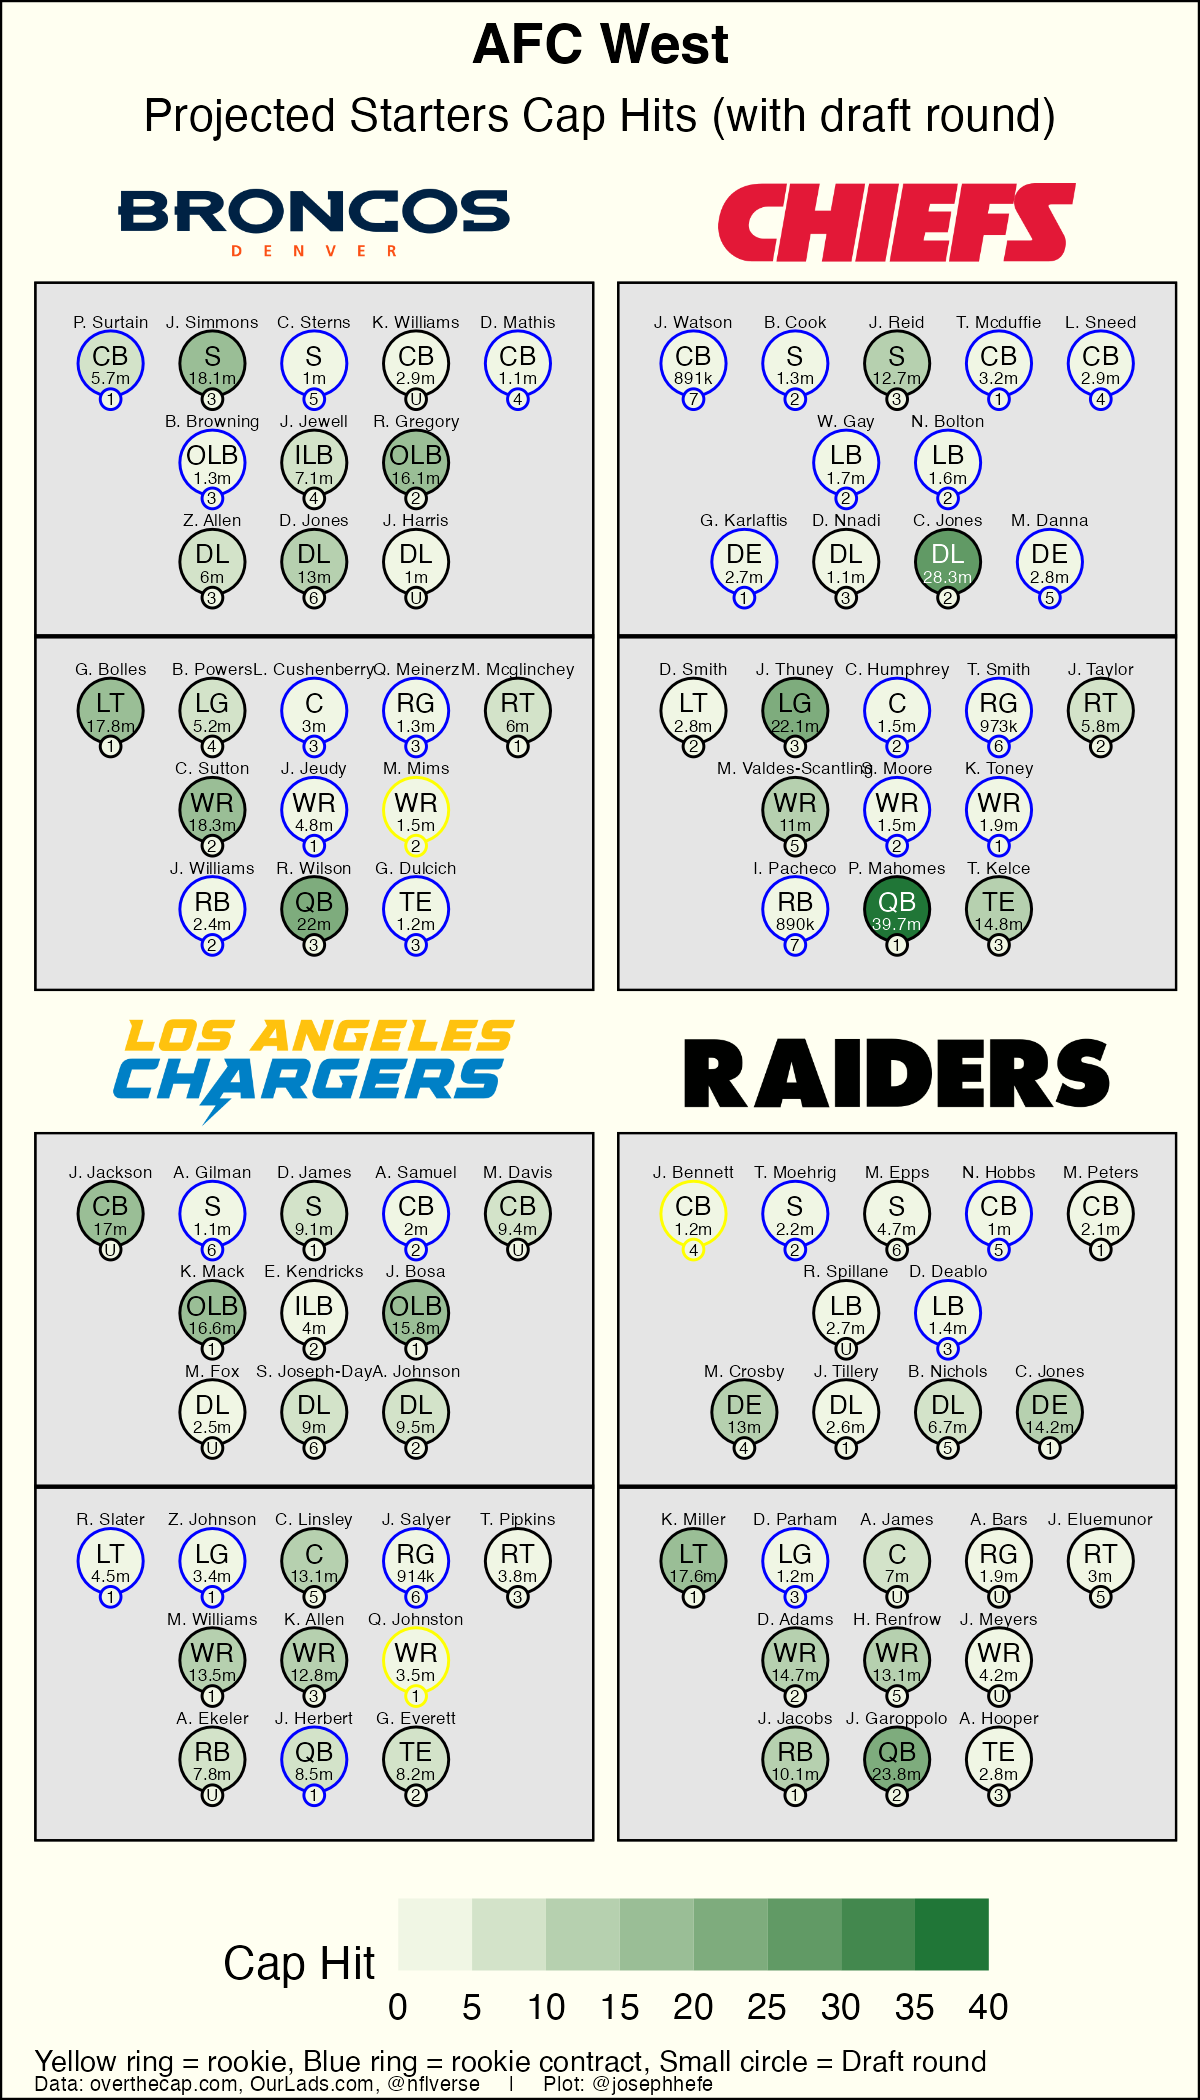
Divisional Starter Cap Hits
This graphic shows the expected starters for each team in an NFL division, and the size of each players cap hit. This allows you to easily see how each team in the division has allocated their cap dollars, giving a general impression of each teams strengths.
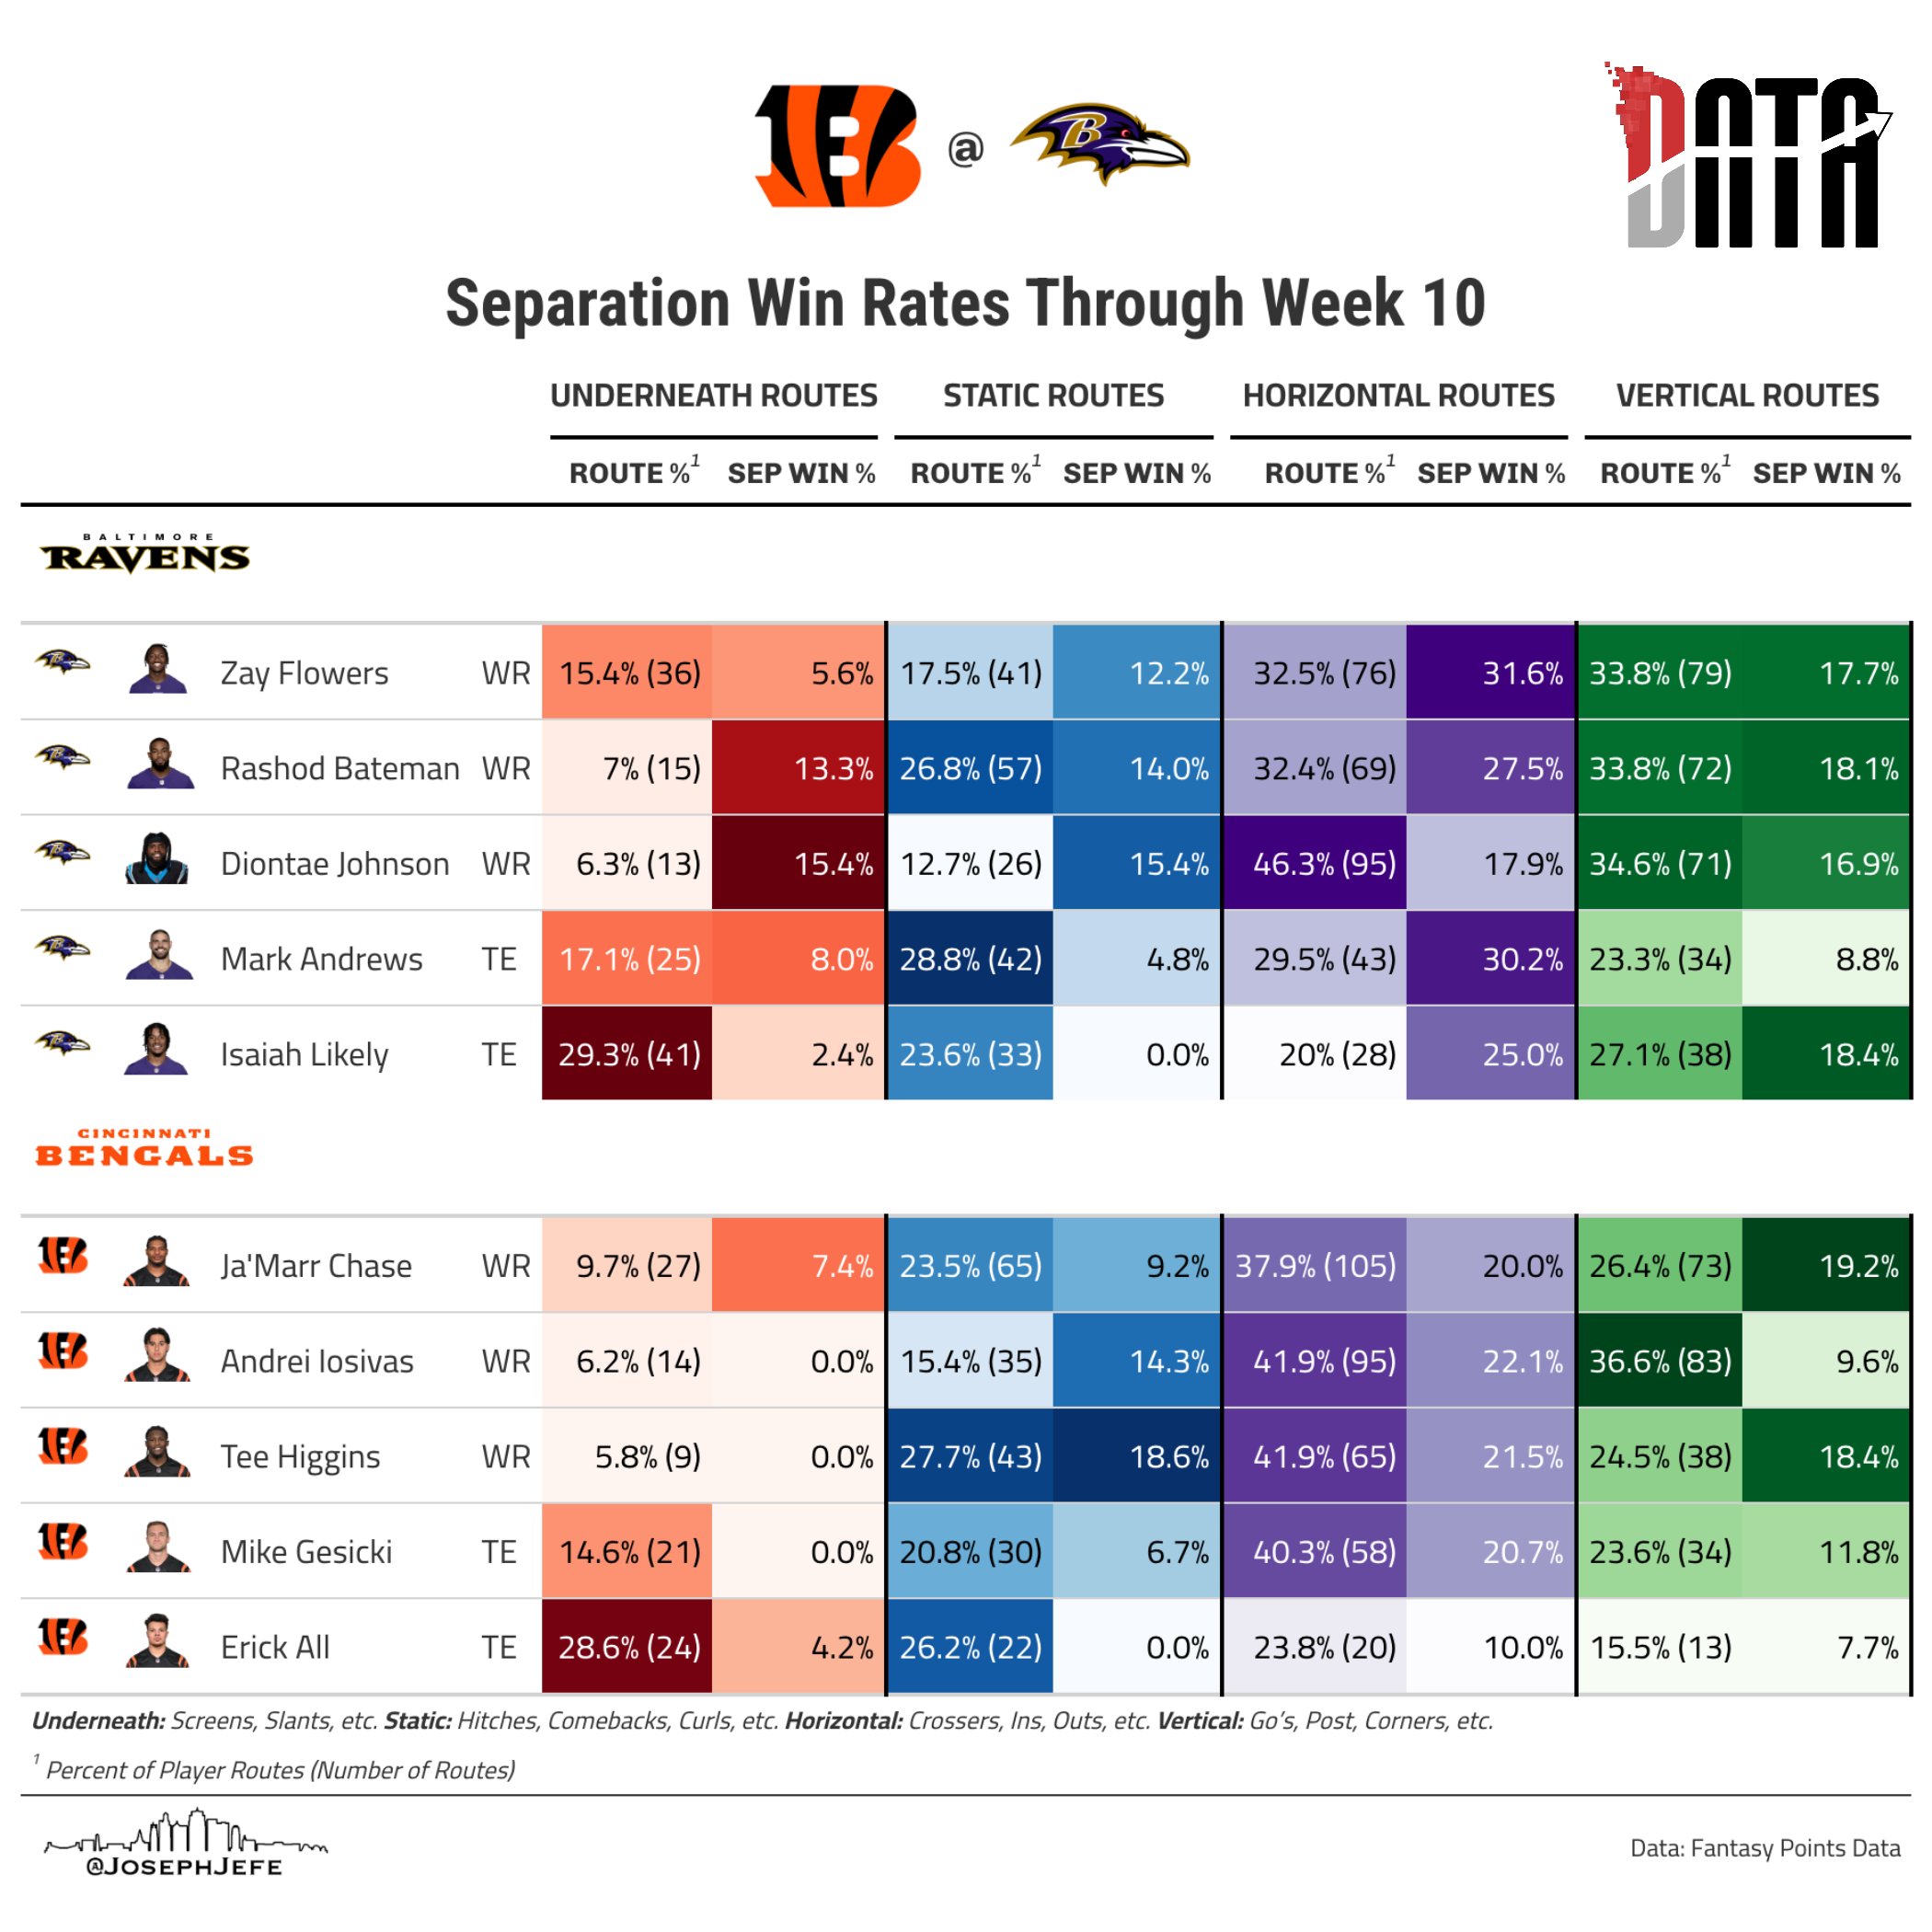
Separation Win Rates
For this graphic, I used Fantasy Points separation stat to look at how often the top receivers in a matchup earn separation, and on what kind of routes.
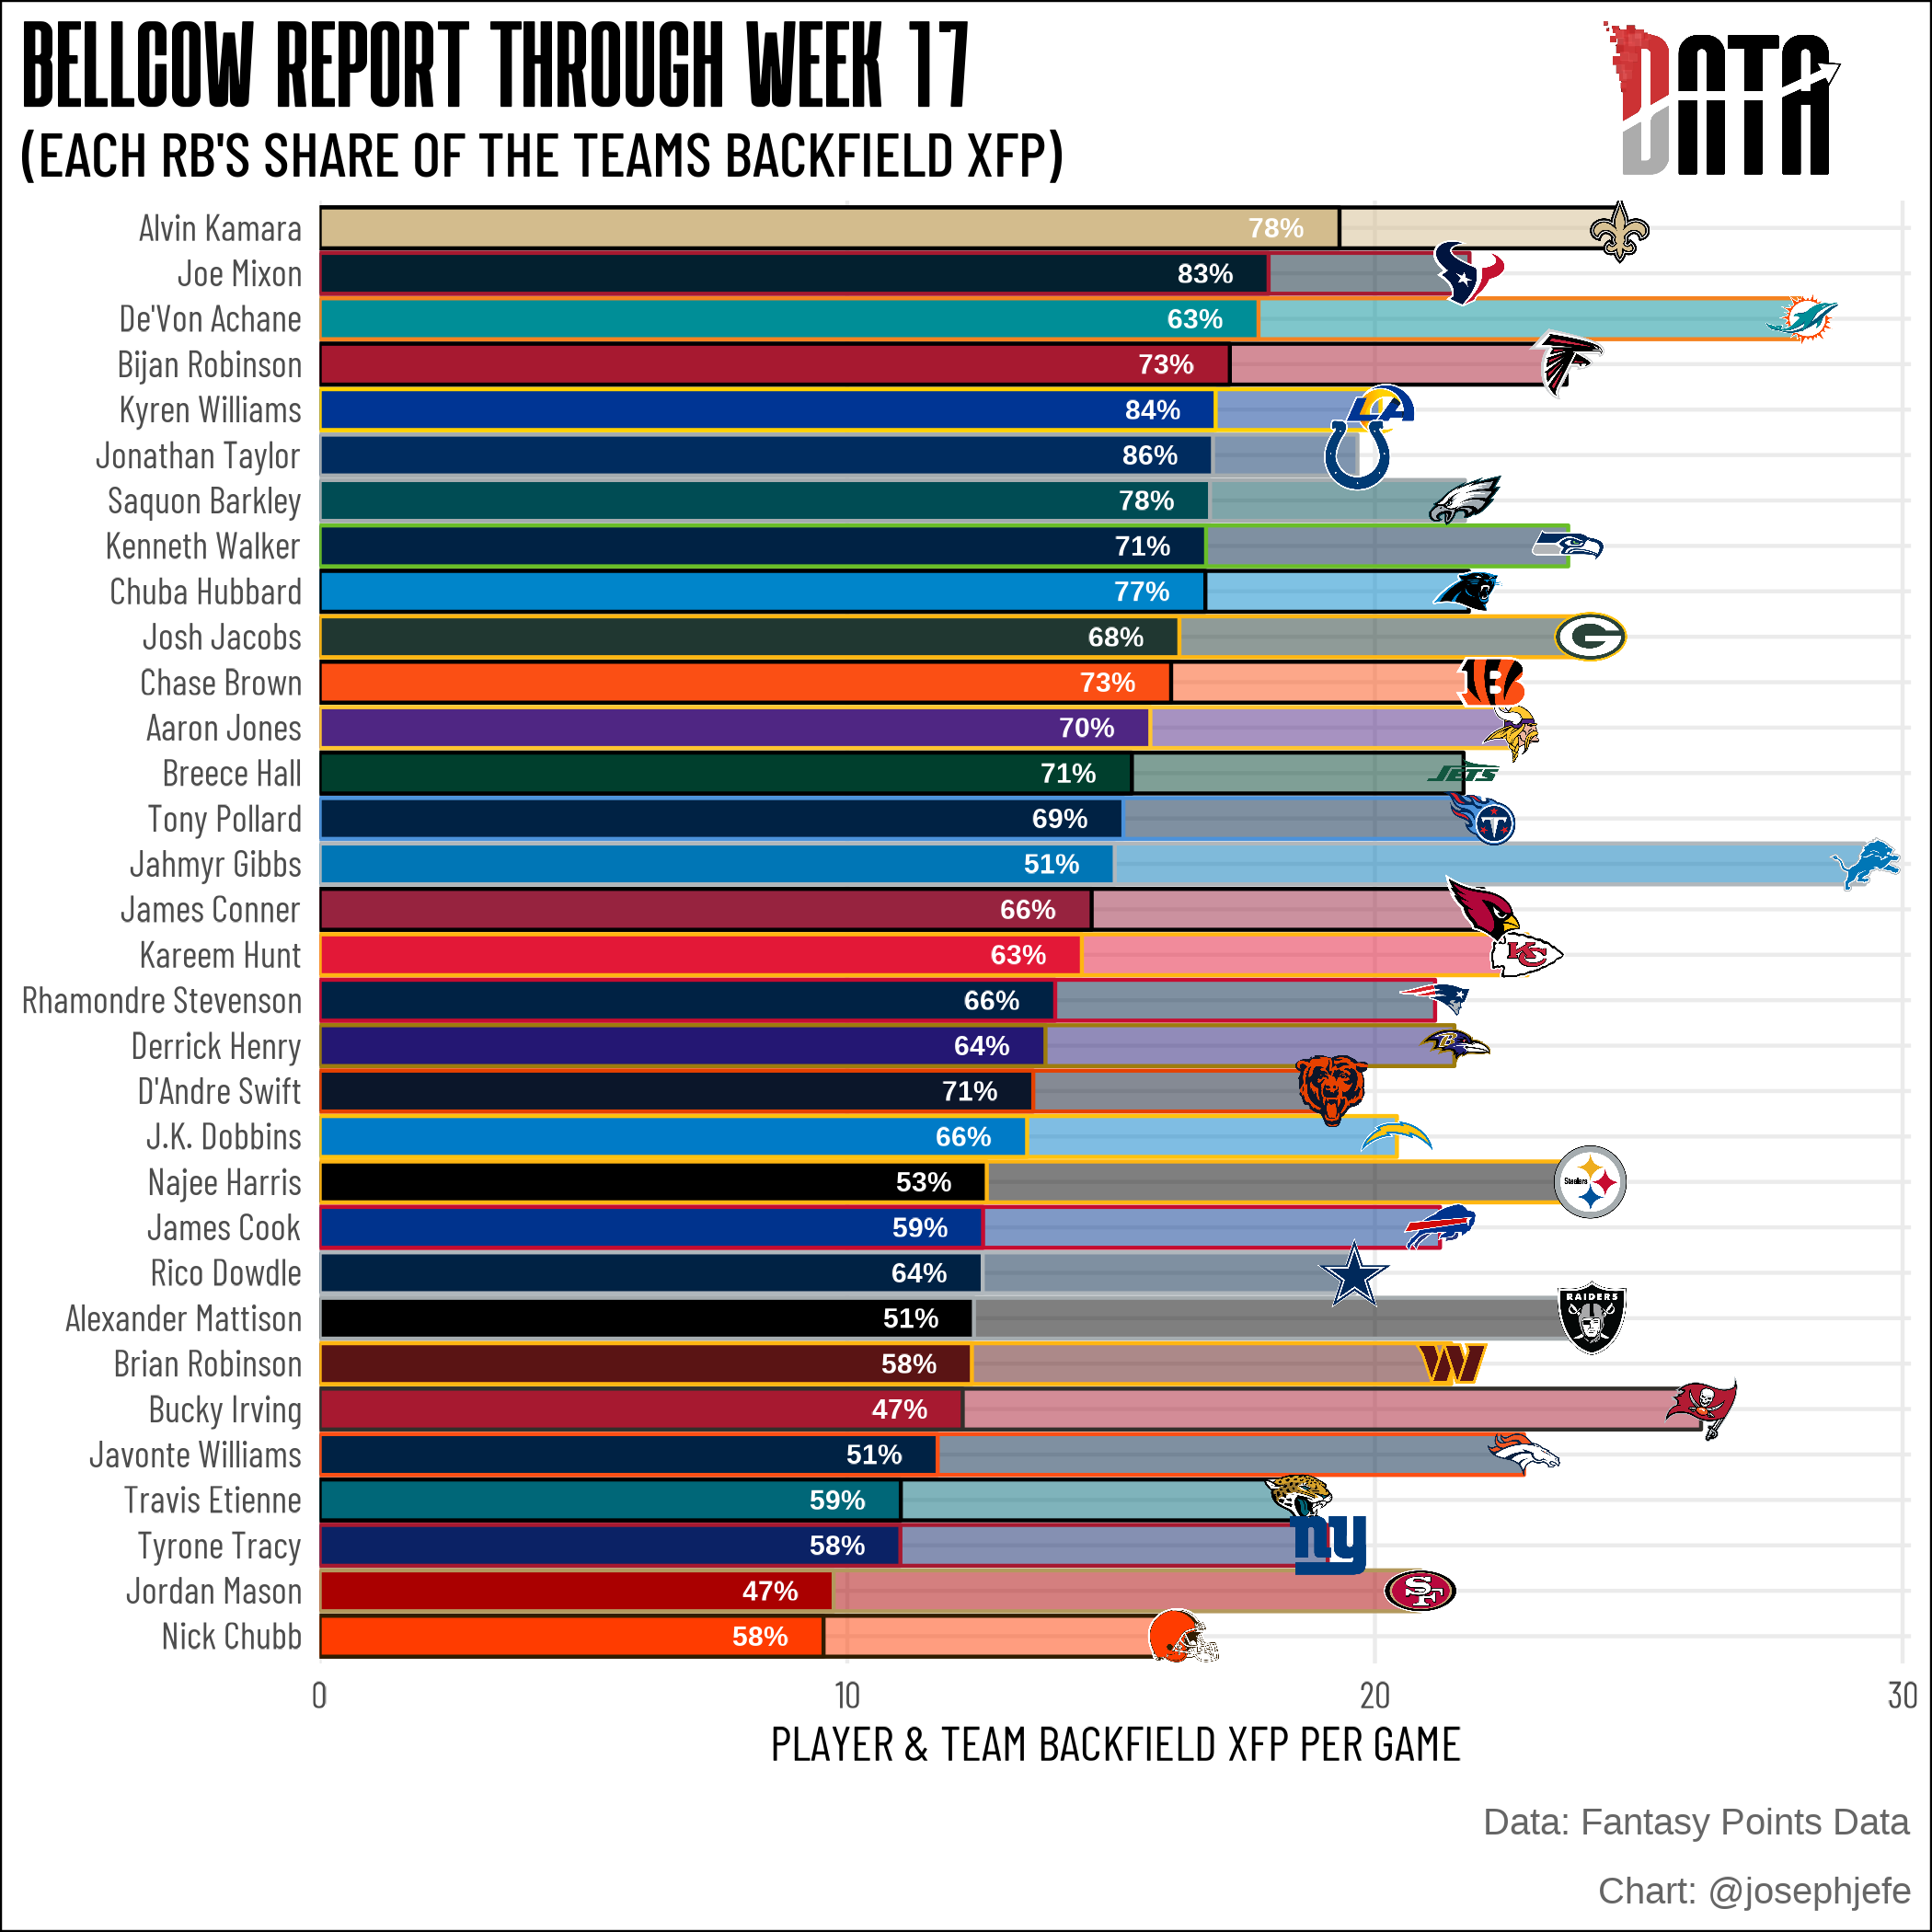
Bellcow Report
Fantasy Points requested this graphic to show their Bell Cow data. It looks at the total fantasy point rushing opportunity, and what percentage of that opportunity the top running back on the team earned.
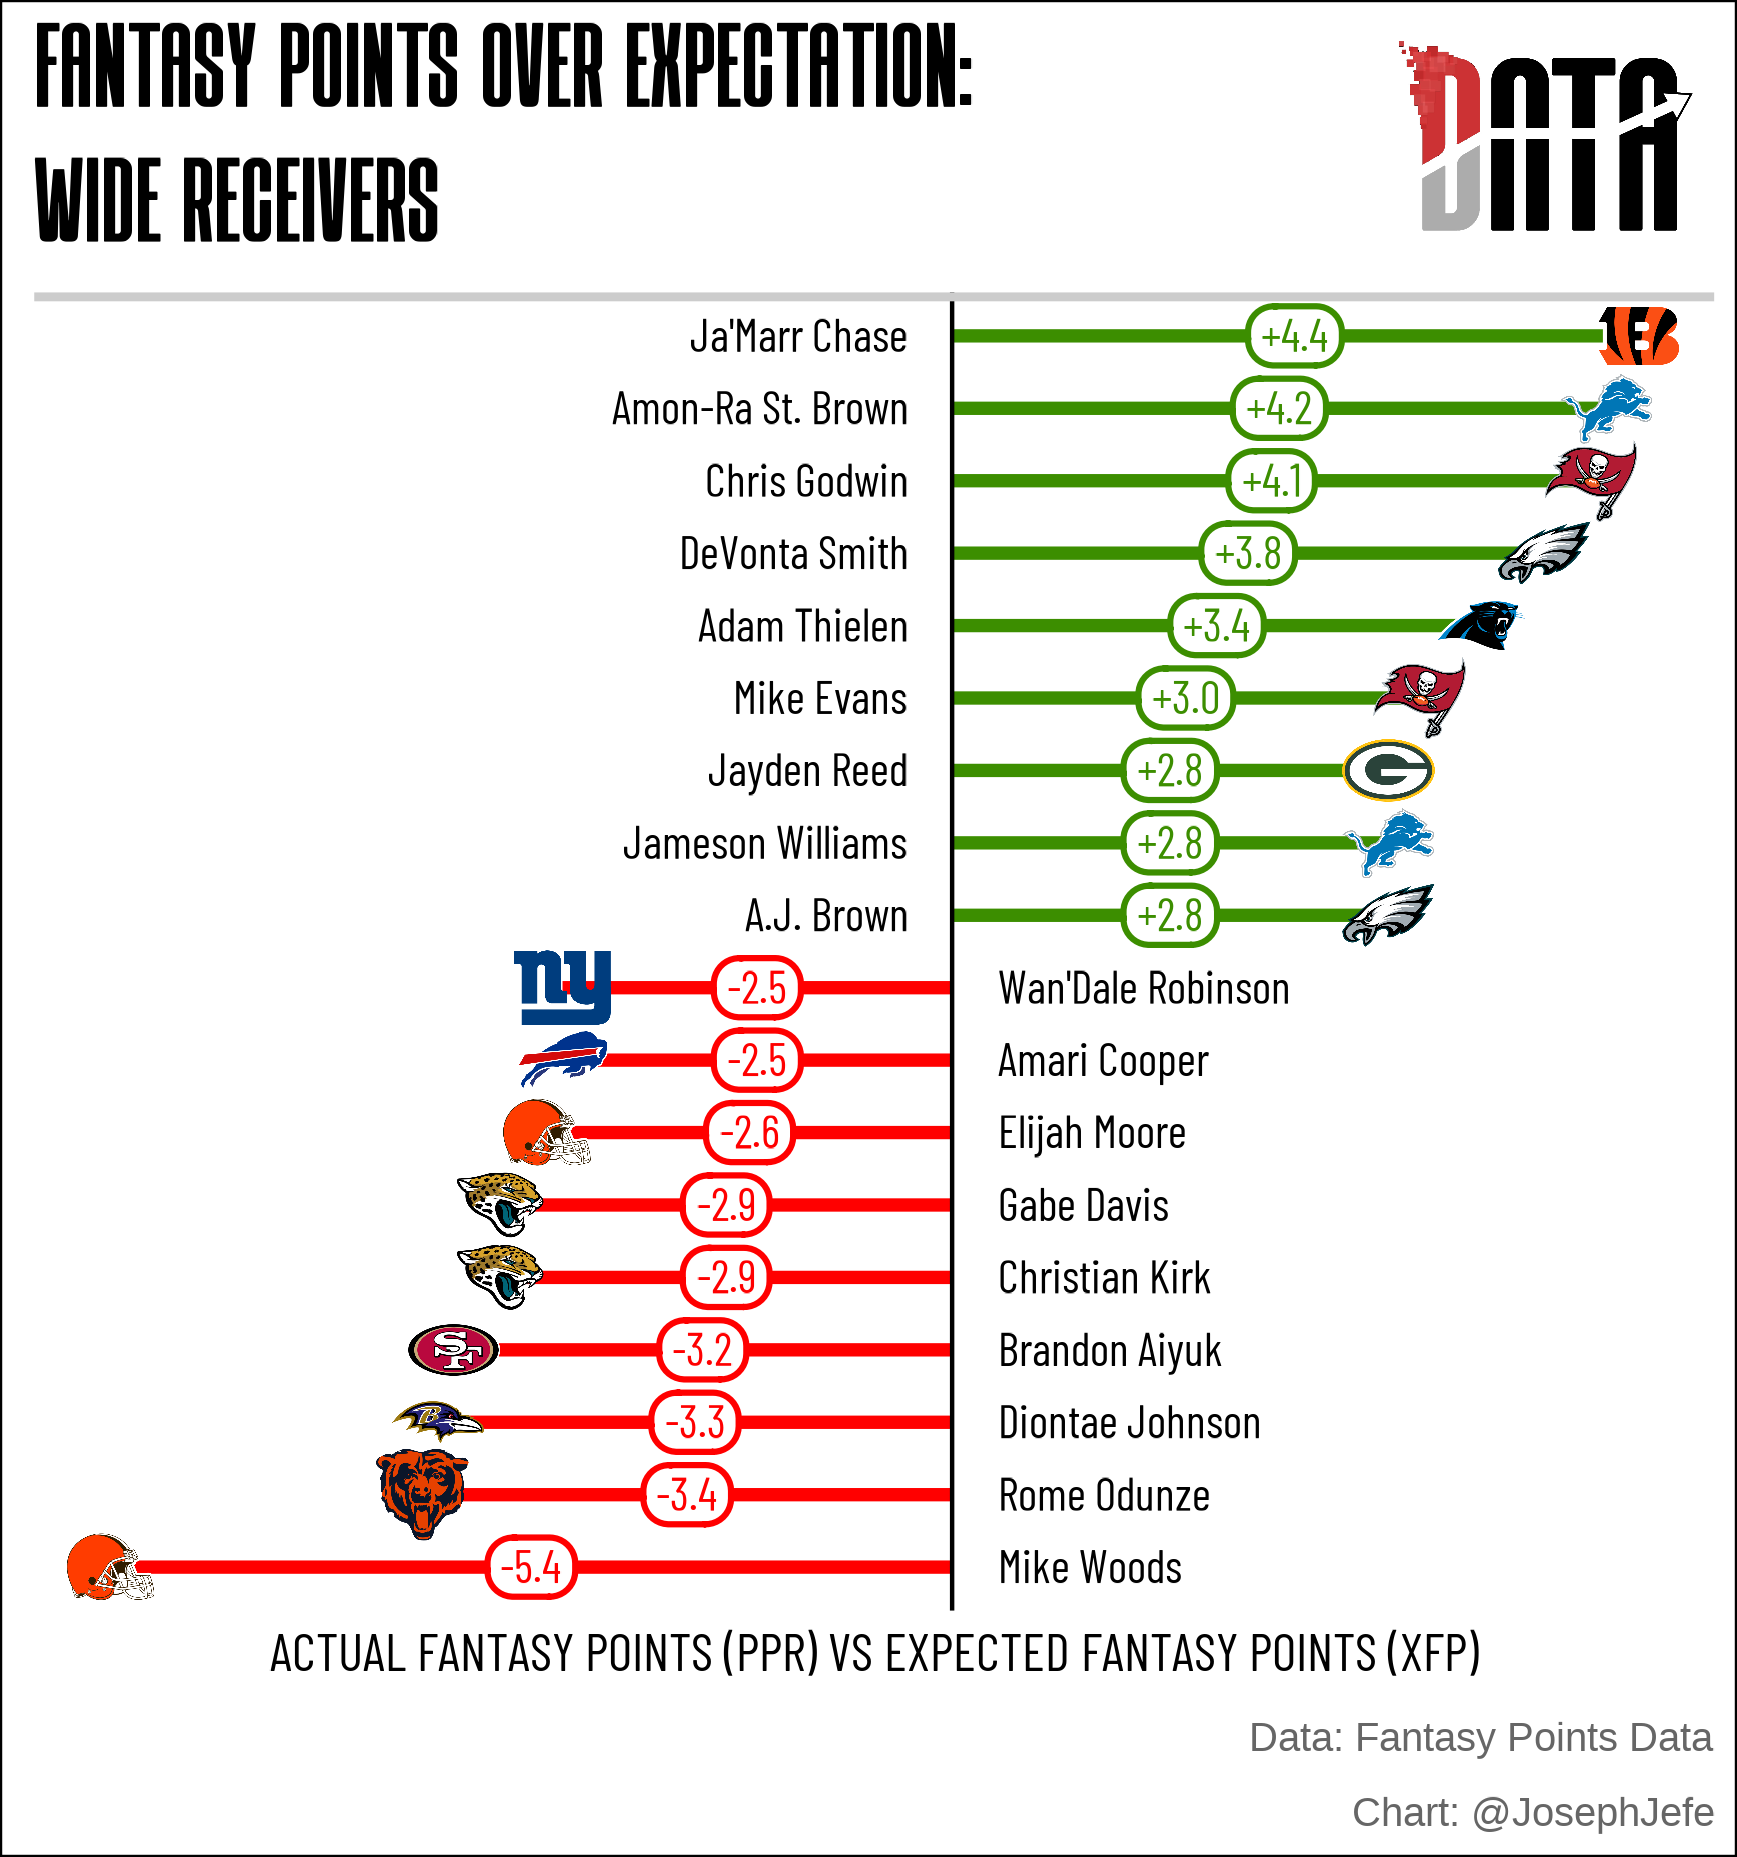
Fantasy Points Over Expectation
This graphic is also one I made for Fantasy Points, and shows which wide receivers have over and under performed their expected fantasy points.